The Particular throughput tool can be installed locally and run against a production system to discover the throughput of each endpoint in a system over a period of time.
This article details how to collect endpoint and throughput data when the system uses the Azure Service Bus transport. Refer to the throughput counter main page for information how to install/uninstall the tool or for other data collection options.
Prerequisites
Collecting metrics from Azure Service Bus relies upon an existing set of Azure credentials set using the Azure Command Line Interface (CLI), which must be installed first:
- Install the Azure CLI.
- From a command line, execute
az login, which will open a browser to complete the authentication to Azure. The Azure login must have access to view metrics data for the Azure Service Bus namespace. - Execute
az account set --subscription {SubscriptionId}, where{SubscriptionId}is a Guid matching the subscription id that contains the Azure Service Bus namespace.
Completing these steps stores credentials that can be used by the tool.
Running the tool
To run the tool, the resource ID for the Azure Service Bus namespace is needed.
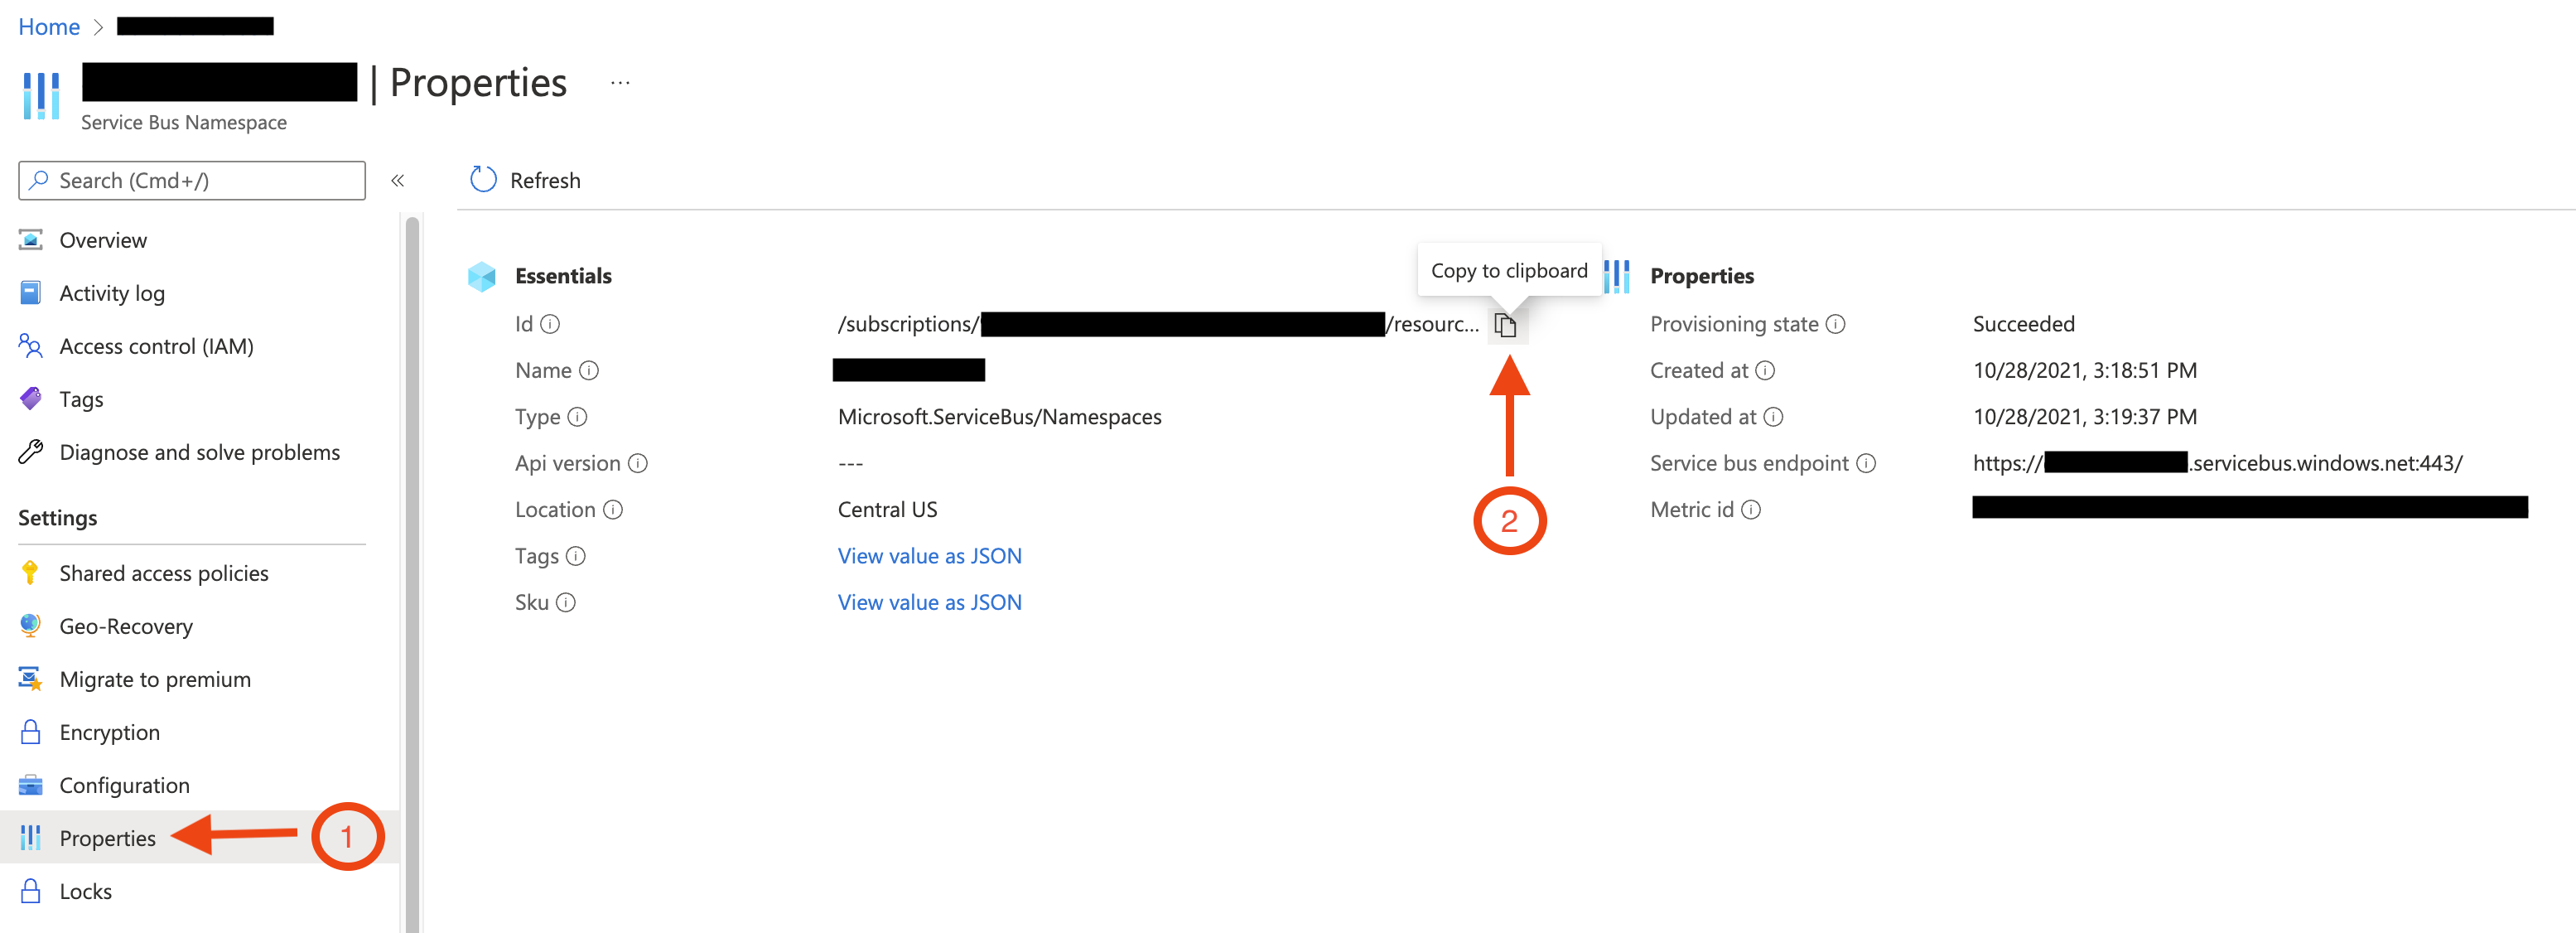
In the Azure Portal, go to the Azure Service Bus namespace, click Properties in the side navigtation (as shown in the screenshot below) and then copy the Id value, which will be needed to run the tool. The Id value should have a format similar to /.
This screenshot shows how to copy the Service Bus Namespace's Id value:
Execute the tool with the resource ID of the Azure Service Bus namespace.
If the tool was installed as a .NET tool:
throughput-counter azureservicebus [options] --resourceId /subscriptions/xxxxxxxx-xxxx-xxxx-xxxx-xxxxxxxxxxxx/resourceGroups/my-resource-group/providers/Microsoft.ServiceBus/namespaces/my-asb-namespace
Or, if using the self-contained executable:
Particular.EndpointThroughputCounter.exe azureservicebus [options] --resourceId /subscriptions/xxxxxxxx-xxxx-xxxx-xxxx-xxxxxxxxxxxx/resourceGroups/my-resource-group/providers/Microsoft.ServiceBus/namespaces/my-asb-namespace
Options
| Option | Description |
|---|---|
--resourceId | Required – The resource ID of the Azure Service Bus namespace, which can be found in the Azure Portal as described above. |
--serviceBusDomain | The Service Bus domain. Defaults to servicebus.. Only necessary for Azure customers using a non-public/government cloud. |
--queueNameMasks | Masks sensitive information in the generated report. See masking private data. |
--customerName | Sets the customer name. If not provided, the tool will prompt for the information. Example: --customerName "Particular Software" |
--unattended | Will not prompt for user input, so that the tool can be used from environments such as a continuous integration system. |
--skipVersionCheck | Will not perform the check, for use in environments when outgoing network access creates alerts. |
What the tool does
First, the tool uses a ServiceBusAdministrationClient to query the queue names from the namespace. Next, a MetricsQueryClient is used to query for CompleteMessage metrics for the past 30 days from each queue.
Using Azure Service Bus metrics allows the tool to capture the last 30 days worth of data at once. Although the tool collects 30 days worth of data, only the highest daily throughput is included in the report.