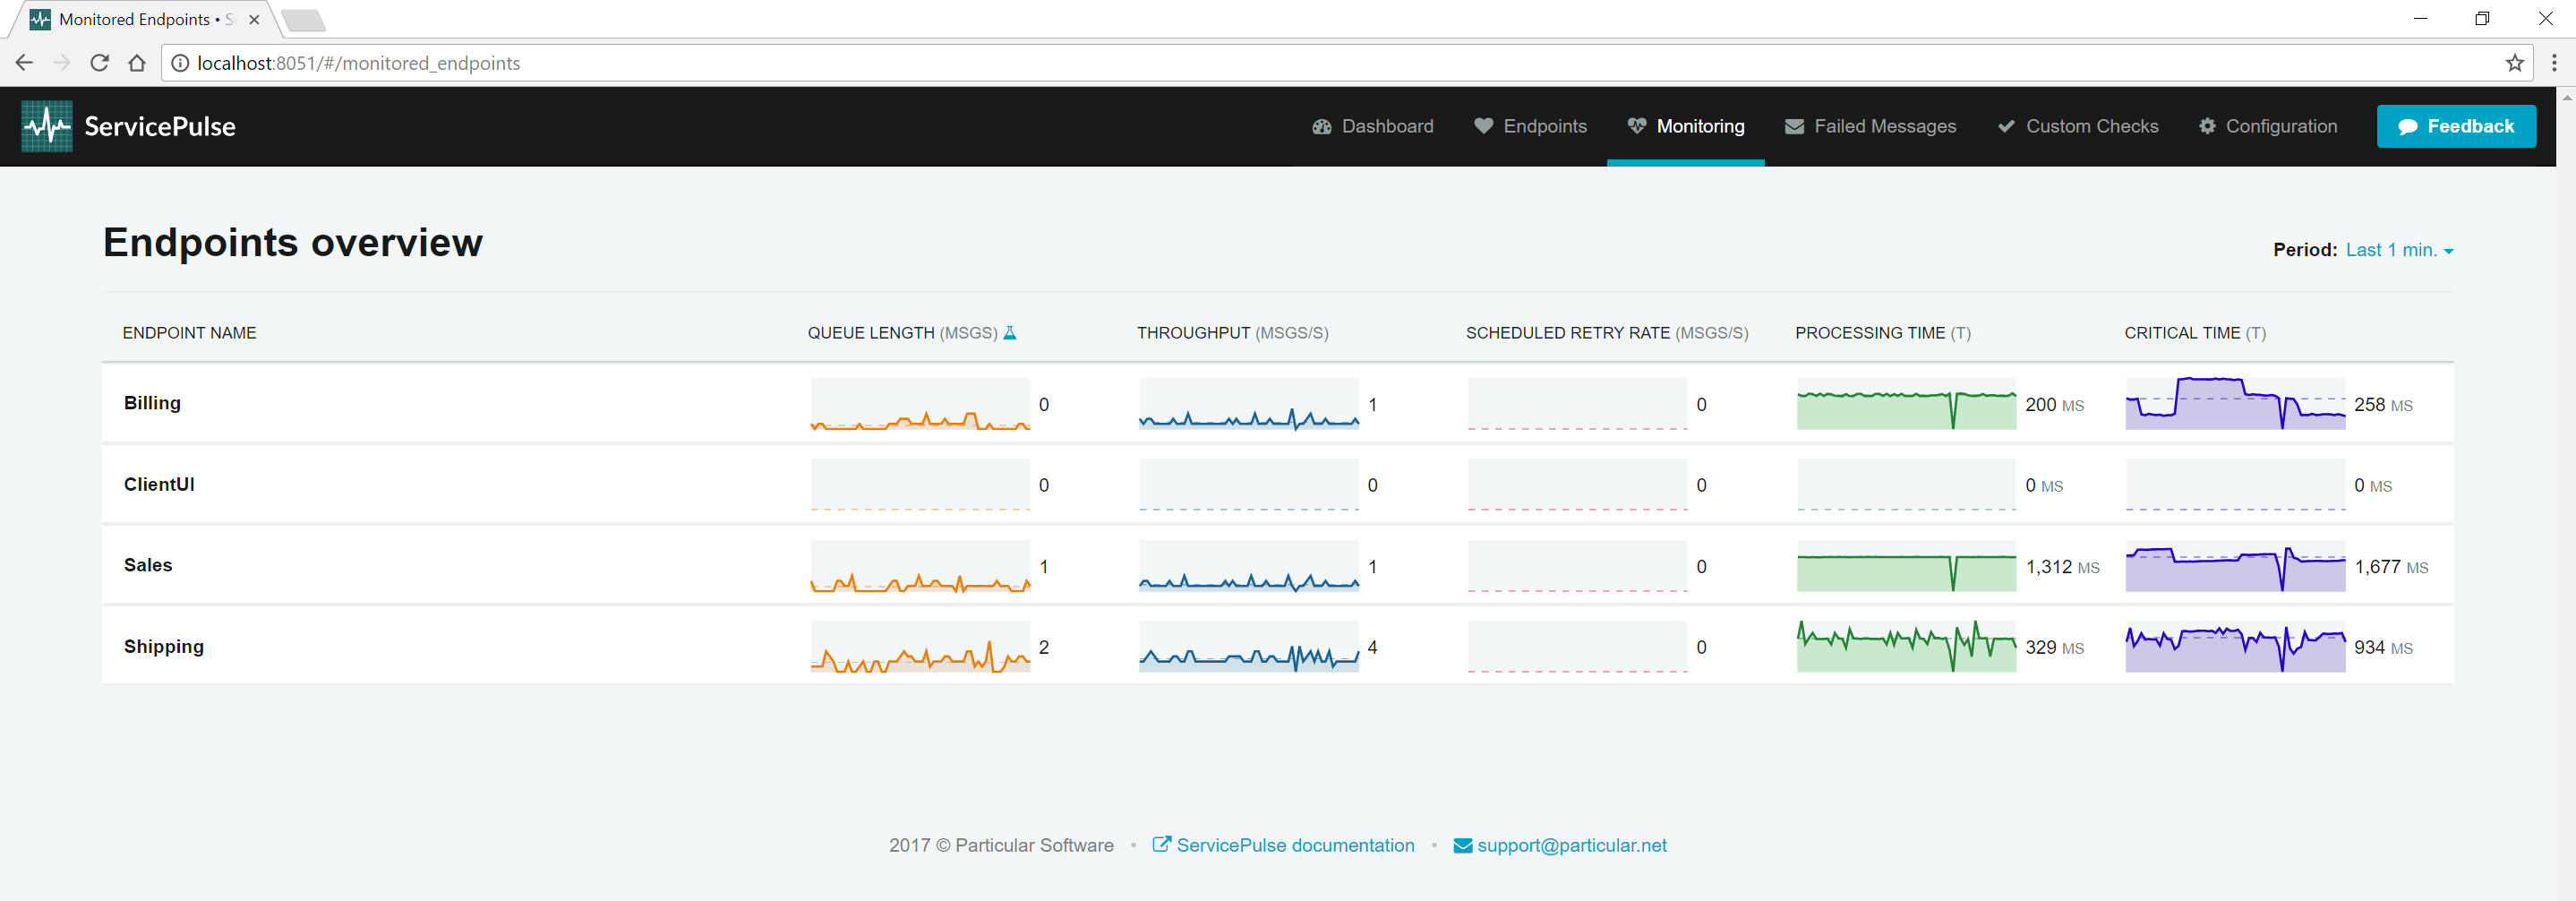
Experience the monitoring features of the Particular Service Platform by running a real-world demo in ServicePulse. This downloadable sample includes all required platform components, pre-configured and ready to use, with four sample endpoints that communicate by exchanging messages.
Prerequisites
To run the sample, ensure you have:
- .NET 10 runtime installed
- Windows operating system:
- Desktop: Windows 8 or later
- Server: Windows Server 2016 or later
While this specific sample requires Windows, the Particular Service Platform does not.
How to run the sample
- Download and extract the zip package.
- Open the extracted folder.
- Double-click
MonitoringDemoto start the demo.
The MonitoringDemo executable runs the sample endpoints, platform components, and opens your default browser to the ServicePulse monitoring tab.
The platform components include a ServiceControl, Monitoring, and ServicePulse instances. Each binds to a free port in the 49200 range.
Demo overview
When running, the demo starts four endpoints configured as shown below:
By default, the ClientUI endpoint sends one PlaceOrder message per second.
All endpoints are configured to send monitoring data to the Particular Service Platform, which you can view in ServicePulse.
The sales endpoint can be scaled out or scaled in by pressing the ↑ or ↓ keys.
Pressing the enter key will quit all processes and cleanup temporary files and folders.
Explore the demo further
Use the monitoring tools in ServicePulse to investigate:
- Which message types take the longest to process? Analyze individual endpoint performance to identify optimization opportunities.
- Which endpoints have the most work to do? Detect traffic peaks to make informed scaling decisions.
- Are any of the endpoints struggling? Uncover and resolve hidden issues before they cause message processing failures.
Start monitoring your own system
If you have an NServiceBus system you'd like to start monitoring, then check out our tutorial for adding monitoring to an existing NServiceBus system.
