Introduction
This sample demonstrates how to capture, store, and visualize NServiceBus metrics in NewRelic, a monitoring solution for storing application performance data, custom events, etc.
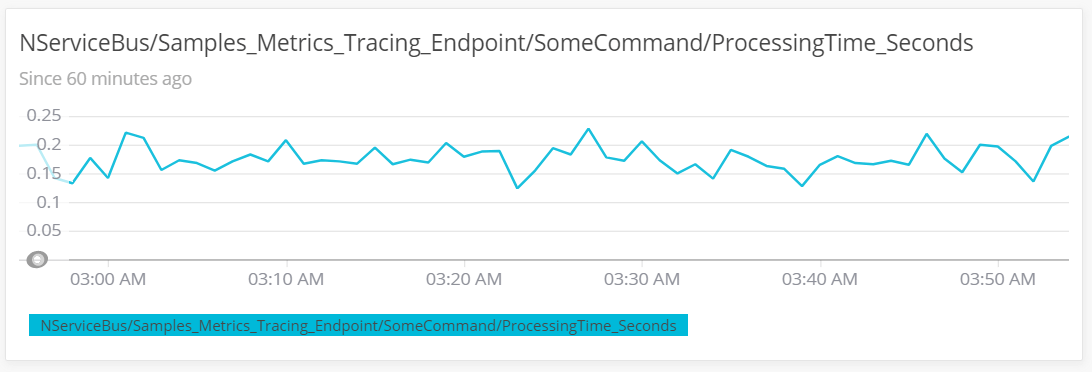
This sample reports the following metrics to NewRelic:
- Fetched messages per second
- Failed messages per second
- Successful messages per second
- Critical time in seconds
- Processing time seconds
- Retries
For a detailed explanation of these metrics, refer to the metrics captured section of the metrics definitions documentation.
Prerequisites
To run this sample, create a NewRelic account, then download and run the NewRelic agent.
See the Introduction to New Relic guide for information on how to get started with NewRelic monitoring.
Code overview
The sample uses the LoadSimulator class to simulate a workload where 10% of the messages fail:
var simulator = new LoadSimulator(endpointInstance, TimeSpan.Zero, TimeSpan.FromSeconds(10));
simulator.Start();
Capturing metric values
Custom observers need to be registered for the metric probes provided via the NServiceBus. package:
var metricsOptions = endpointConfiguration.EnableMetrics();
The names provided by the NServiceBus. probes do not follow the naming conventions recommended by NewRelic. The names can be aligned with the naming conventions defined by NewRelic using the following mapping:
var endpointName = endpointConfiguration.GetSettings().EndpointName();

var nameMapping = new Dictionary<string, string>
{
    // https://docs.newrelic.com/docs/agents/manage-apm-agents/agent-data/collect-custom-metrics
    {"# of msgs successfully processed / sec", FormatMetric("Success_Total", endpointName)},
    {"# of msgs pulled from the input queue /sec", FormatMetric("Fetched_Total", endpointName)},
    {"# of msgs failures / sec", FormatMetric("Failure_Total", endpointName)},
    {"Critical Time", FormatMetric("CriticalTime_Seconds", endpointName)},
    {"Processing Time", FormatMetric("ProcessingTime_Seconds", endpointName)},
};
The registered observers convert NServiceBus.Metric Signals to NewRelic ResponseTimeMetrics and NServiceBus.Metric Durations to NewRelic Metrics.
metricsOptions.RegisterObservers(
    register: probeContext =>
    {
        RegisterProbes(probeContext, endpointName, nameMapping);
    });
During the metric registration, the following steps are required:
- Map metric names including the endpoint name and message type, if available
- Register observer callbacks
- Record response times and metrics in the observer callback
foreach (var duration in context.Durations)
{
    duration.Register((ref DurationEvent @event) =>
    {
        nameMapping.TryGetValue(duration.Name, out var mappedName);
        var newRelicName = string.Format(mappedName ?? FormatMetric(duration.Name, endpointName), Normalize(@event.MessageType));
        NewRelic.RecordResponseTimeMetric(newRelicName, Convert.ToInt64(@event.Duration.TotalMilliseconds));
    });
}

foreach (var signal in context.Signals)
{
    signal.Register((ref SignalEvent @event) =>
    {
        nameMapping.TryGetValue(signal.Name, out var mappedName);
        var newRelicName = string.Format(mappedName ?? FormatMetric(signal.Name, endpointName), Normalize(@event.MessageType));
        NewRelic.RecordMetric(newRelicName, 1);
    });
}
The NewRelic agent needs to be configured to monitor the application by modifying the app. file:
<appSettings>
  <add key="NewRelic.AgentEnabled" value="true" />
  <add key="NewRelic.AppName" value="NewRelic_Metrics4" />
</appSettings>
Dashboard
The official New Relic NServiceBus integration provides a quickstart with a pre-built dashboard and alert policies. The quickstart dashboard displays standard .NET APM metrics such as transaction throughput, error rates, and VM resource utilization. It does not display the custom NServiceBus metrics reported by this sample.
Create a custom dashboard
To visualize the custom NServiceBus metrics reported by this sample, create a dashboard in New Relic One using NRQL queries:
Navigate to All capabilities > Dashboards.
Click + Create a dashboard and select Create a new dashboard.
Add a chart by clicking + Add widget and selecting Add a chart.
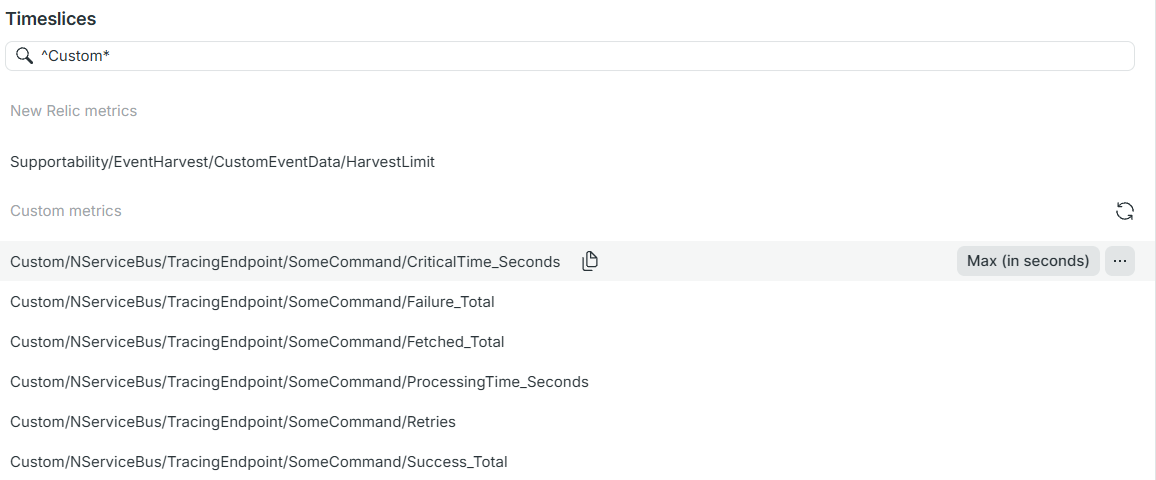
Query the custom metrics using NRQL. Start by typing
Customin the search bar. As an example, the following query returns a processing time chart:SELECT average(newrelic.timeslice.value) FROM Metric WHERE appName = 'NewRelicSample' AND metricTimesliceName LIKE 'Custom/NServiceBus/TracingEndpoint/%/ProcessingTime_Seconds' TIMESERIESUse
metricTimesliceName LIKE 'Custom/to browse all metrics sent by the sample. See the New Relic documentation on querying APM metric timeslice data for more details.NServiceBus/ TracingEndpoint/ %' Click Run to preview the chart, then Save to add it to the dashboard.
To list all the metrics in the sample, go to Data Explorer within the Add Widget wizard, select Timeslices and type:^Custom/.