Introduction
This sample demonstrates how to capture, store, and visualize NServiceBus metrics in Datadog, a monitoring solution for storing application performance data.
This sample reports the following metrics to Datadog:
- Fetched messages per second
- Failed messages per second
- Successful messages per second
- Critical time in seconds
- Processing time seconds
- Retries
For a detailed explanation of these metrics refer to the metrics captured section in the metrics documentation section.
Prerequisites
To run this sample, create a Datadog account, then download and install the Datadog agent. See the Introduction to Datadog guide for information on how to get started with Datadog metrics.
Code overview
The sample simulates messages load with a random 10% failure rate using the LoadSimulator class: LoadSimulator
Capturing metric values
Setup Datadog client. Let's assume the Datadog agent runs on the default address and port.
var dogstatsdConfig = new StatsdConfig
{
    StatsdServerName = "127.0.0.1",
    StatsdPort = 8125
}; //Datadog agent default address, port

DogStatsd.Configure(dogstatsdConfig);
Custom observers need to be registered for the metric probes provided via the NServiceBus. package. The registered observers convert NServiceBus.Metric Signals to Datadog Count and NServiceBus.Metric Durations to Datadog Timer.
metricsOptions.RegisterObservers(register: probeContext =>
    {
        foreach (var duration in probeContext.Durations)
        {
            if (!nameMapping.ContainsKey(duration.Name))
            {
                continue;
            }
            duration.Register((ref DurationEvent @event) =>
            {
                var statName = ComposeStatName(duration.Name);
                var tags = ComposeTags(@event.MessageType);
                DogStatsd.Timer(statName, @event.Duration.TotalMilliseconds, tags: tags);
            });
        }

        foreach (var signal in probeContext.Signals)
        {
            if (!nameMapping.ContainsKey(signal.Name))
            {
                continue;
            }
            signal.Register((ref SignalEvent @event) =>
            {
                var statName = ComposeStatName(signal.Name);
                var tags = ComposeTags(@event.MessageType);
                DogStatsd.Increment(statName, tags: tags);
            });
        }
    });
Dashboard
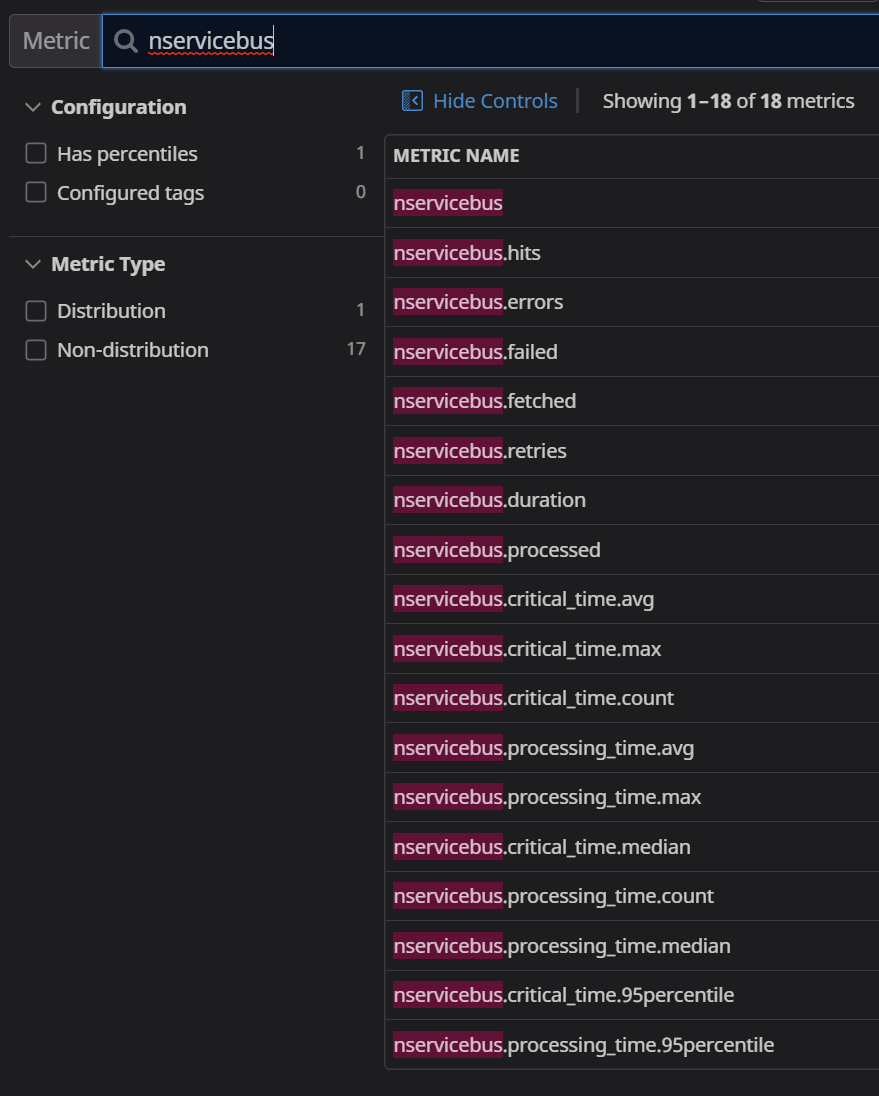
Available metrics
The following metrics are available across all endpoints. Use the tagged values endpoint, messagetype_name, and messagetype_fullname to aggregate and filter a metric.
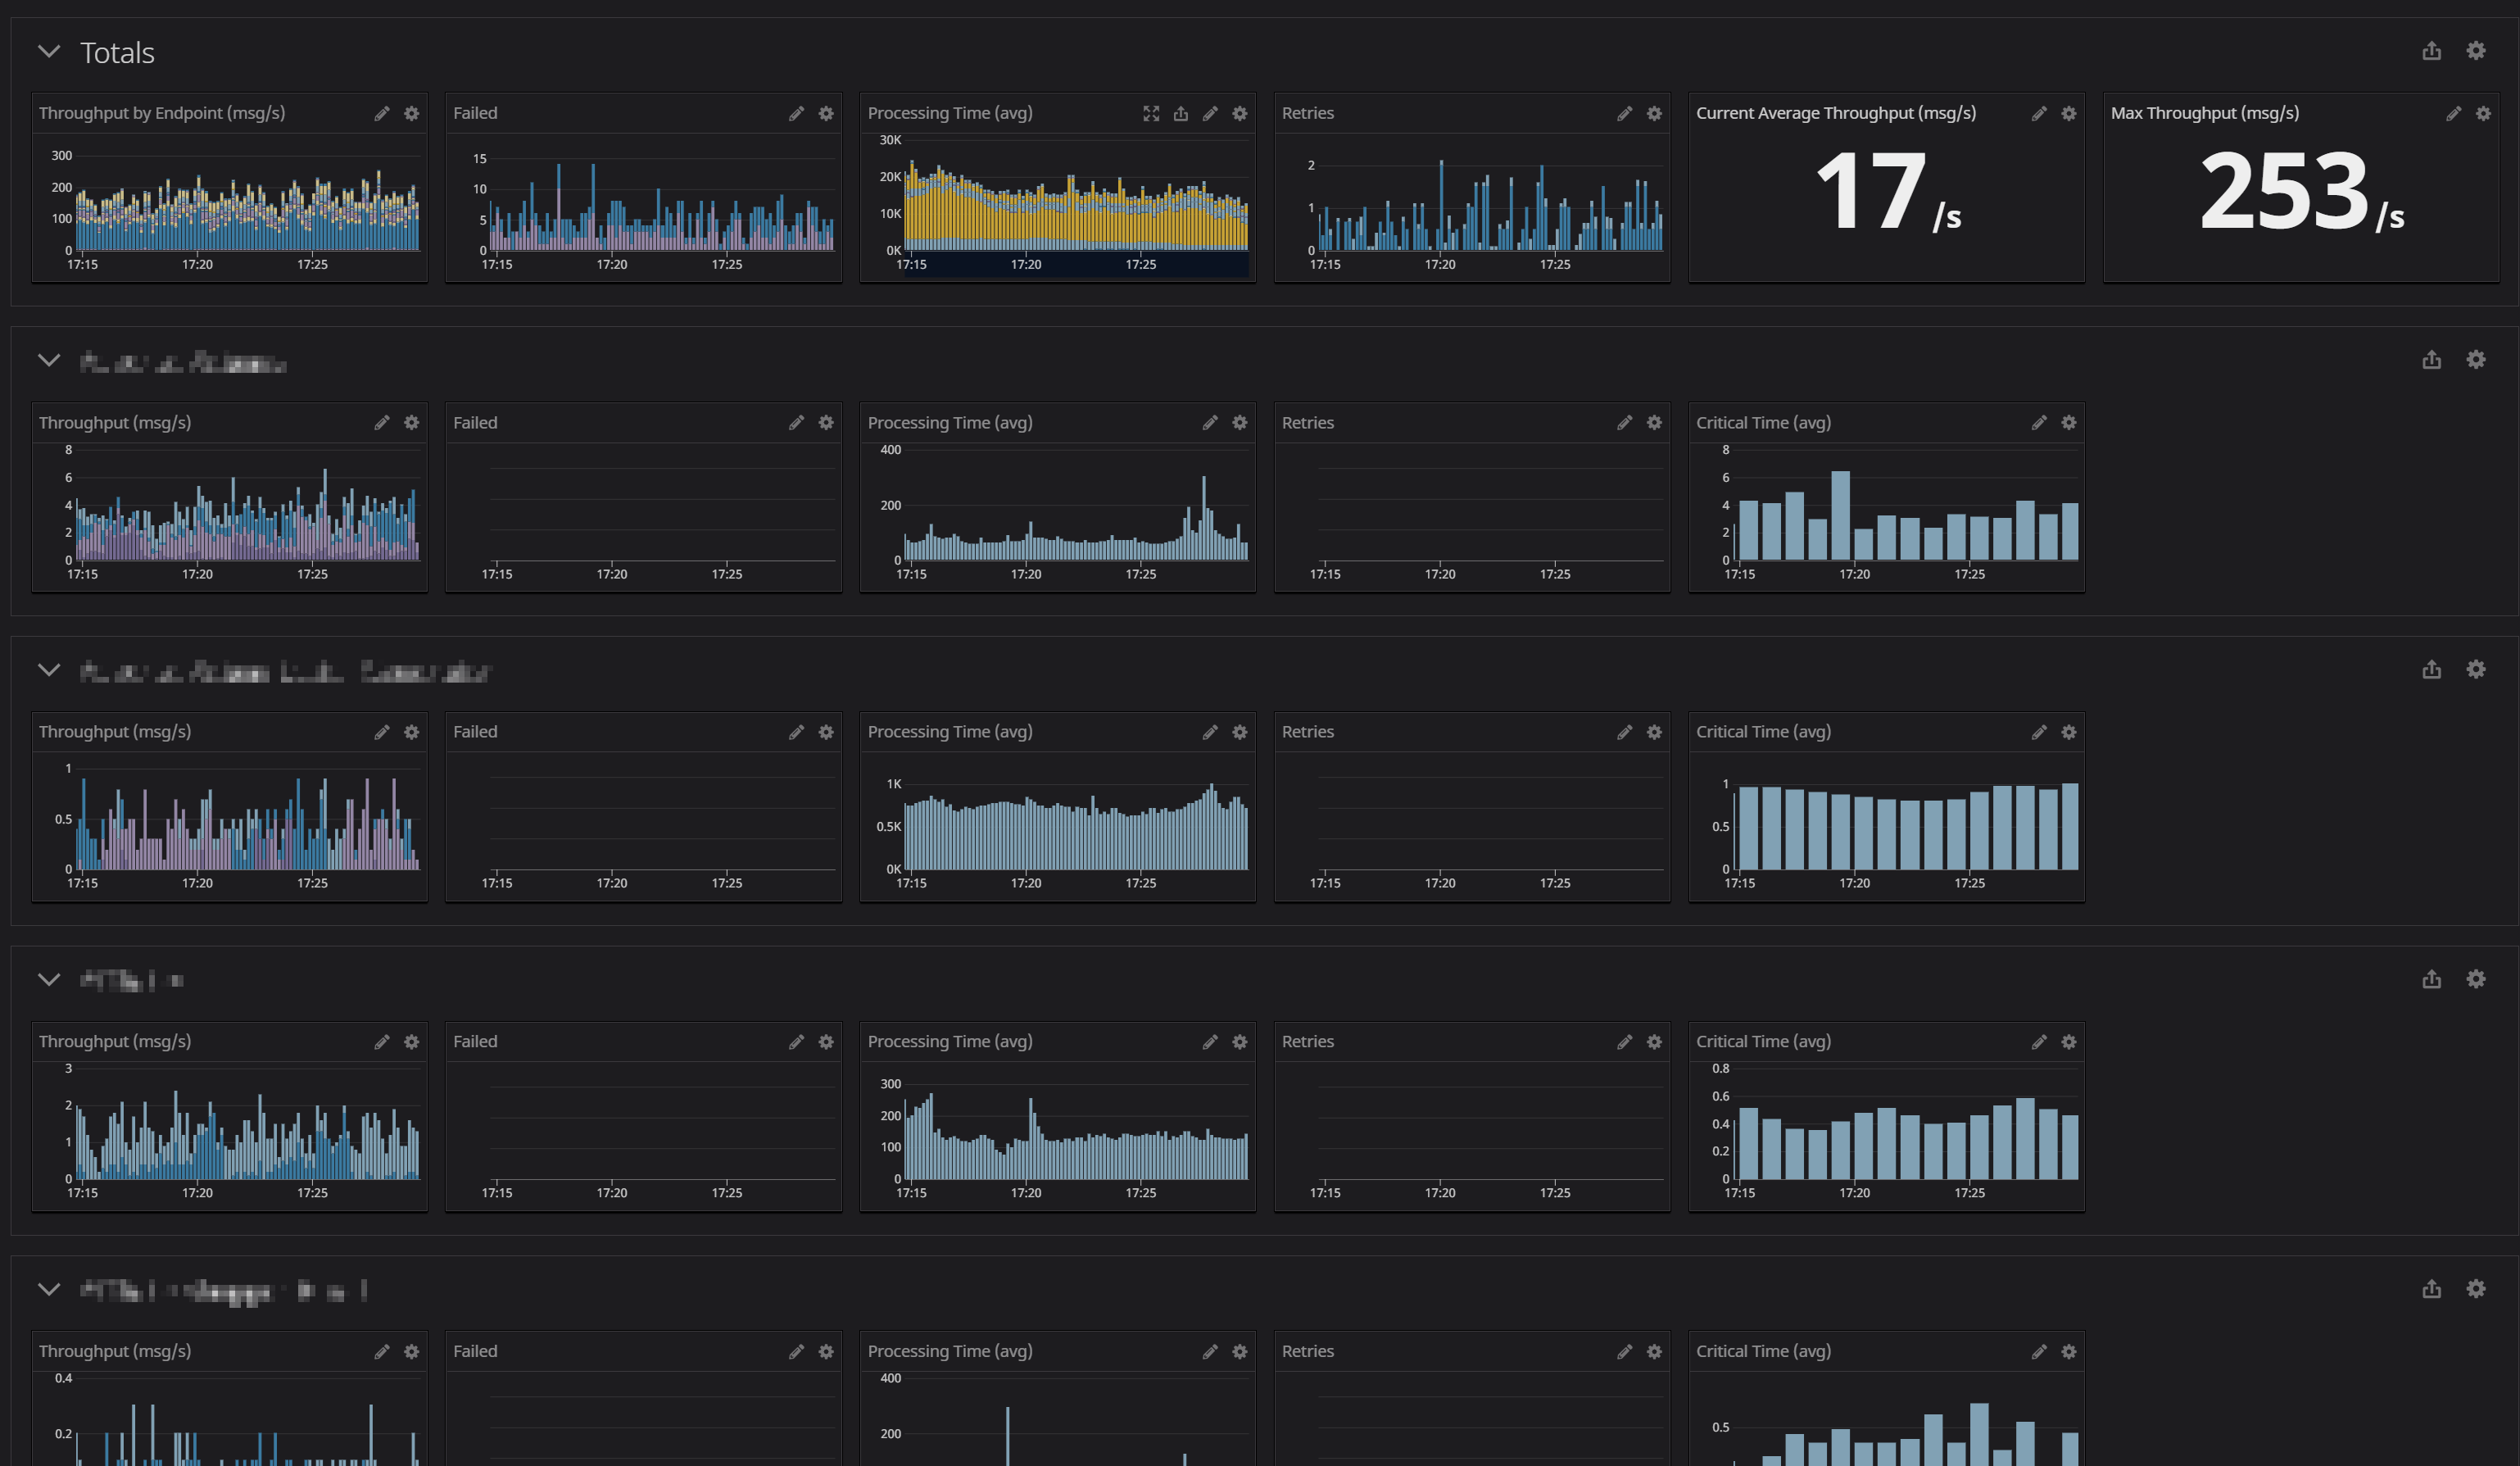
Sample dashboard
This dashboard replicates a lot of the data displayed by ServicePulse. However, DataDog affords a much longer history to draw from.
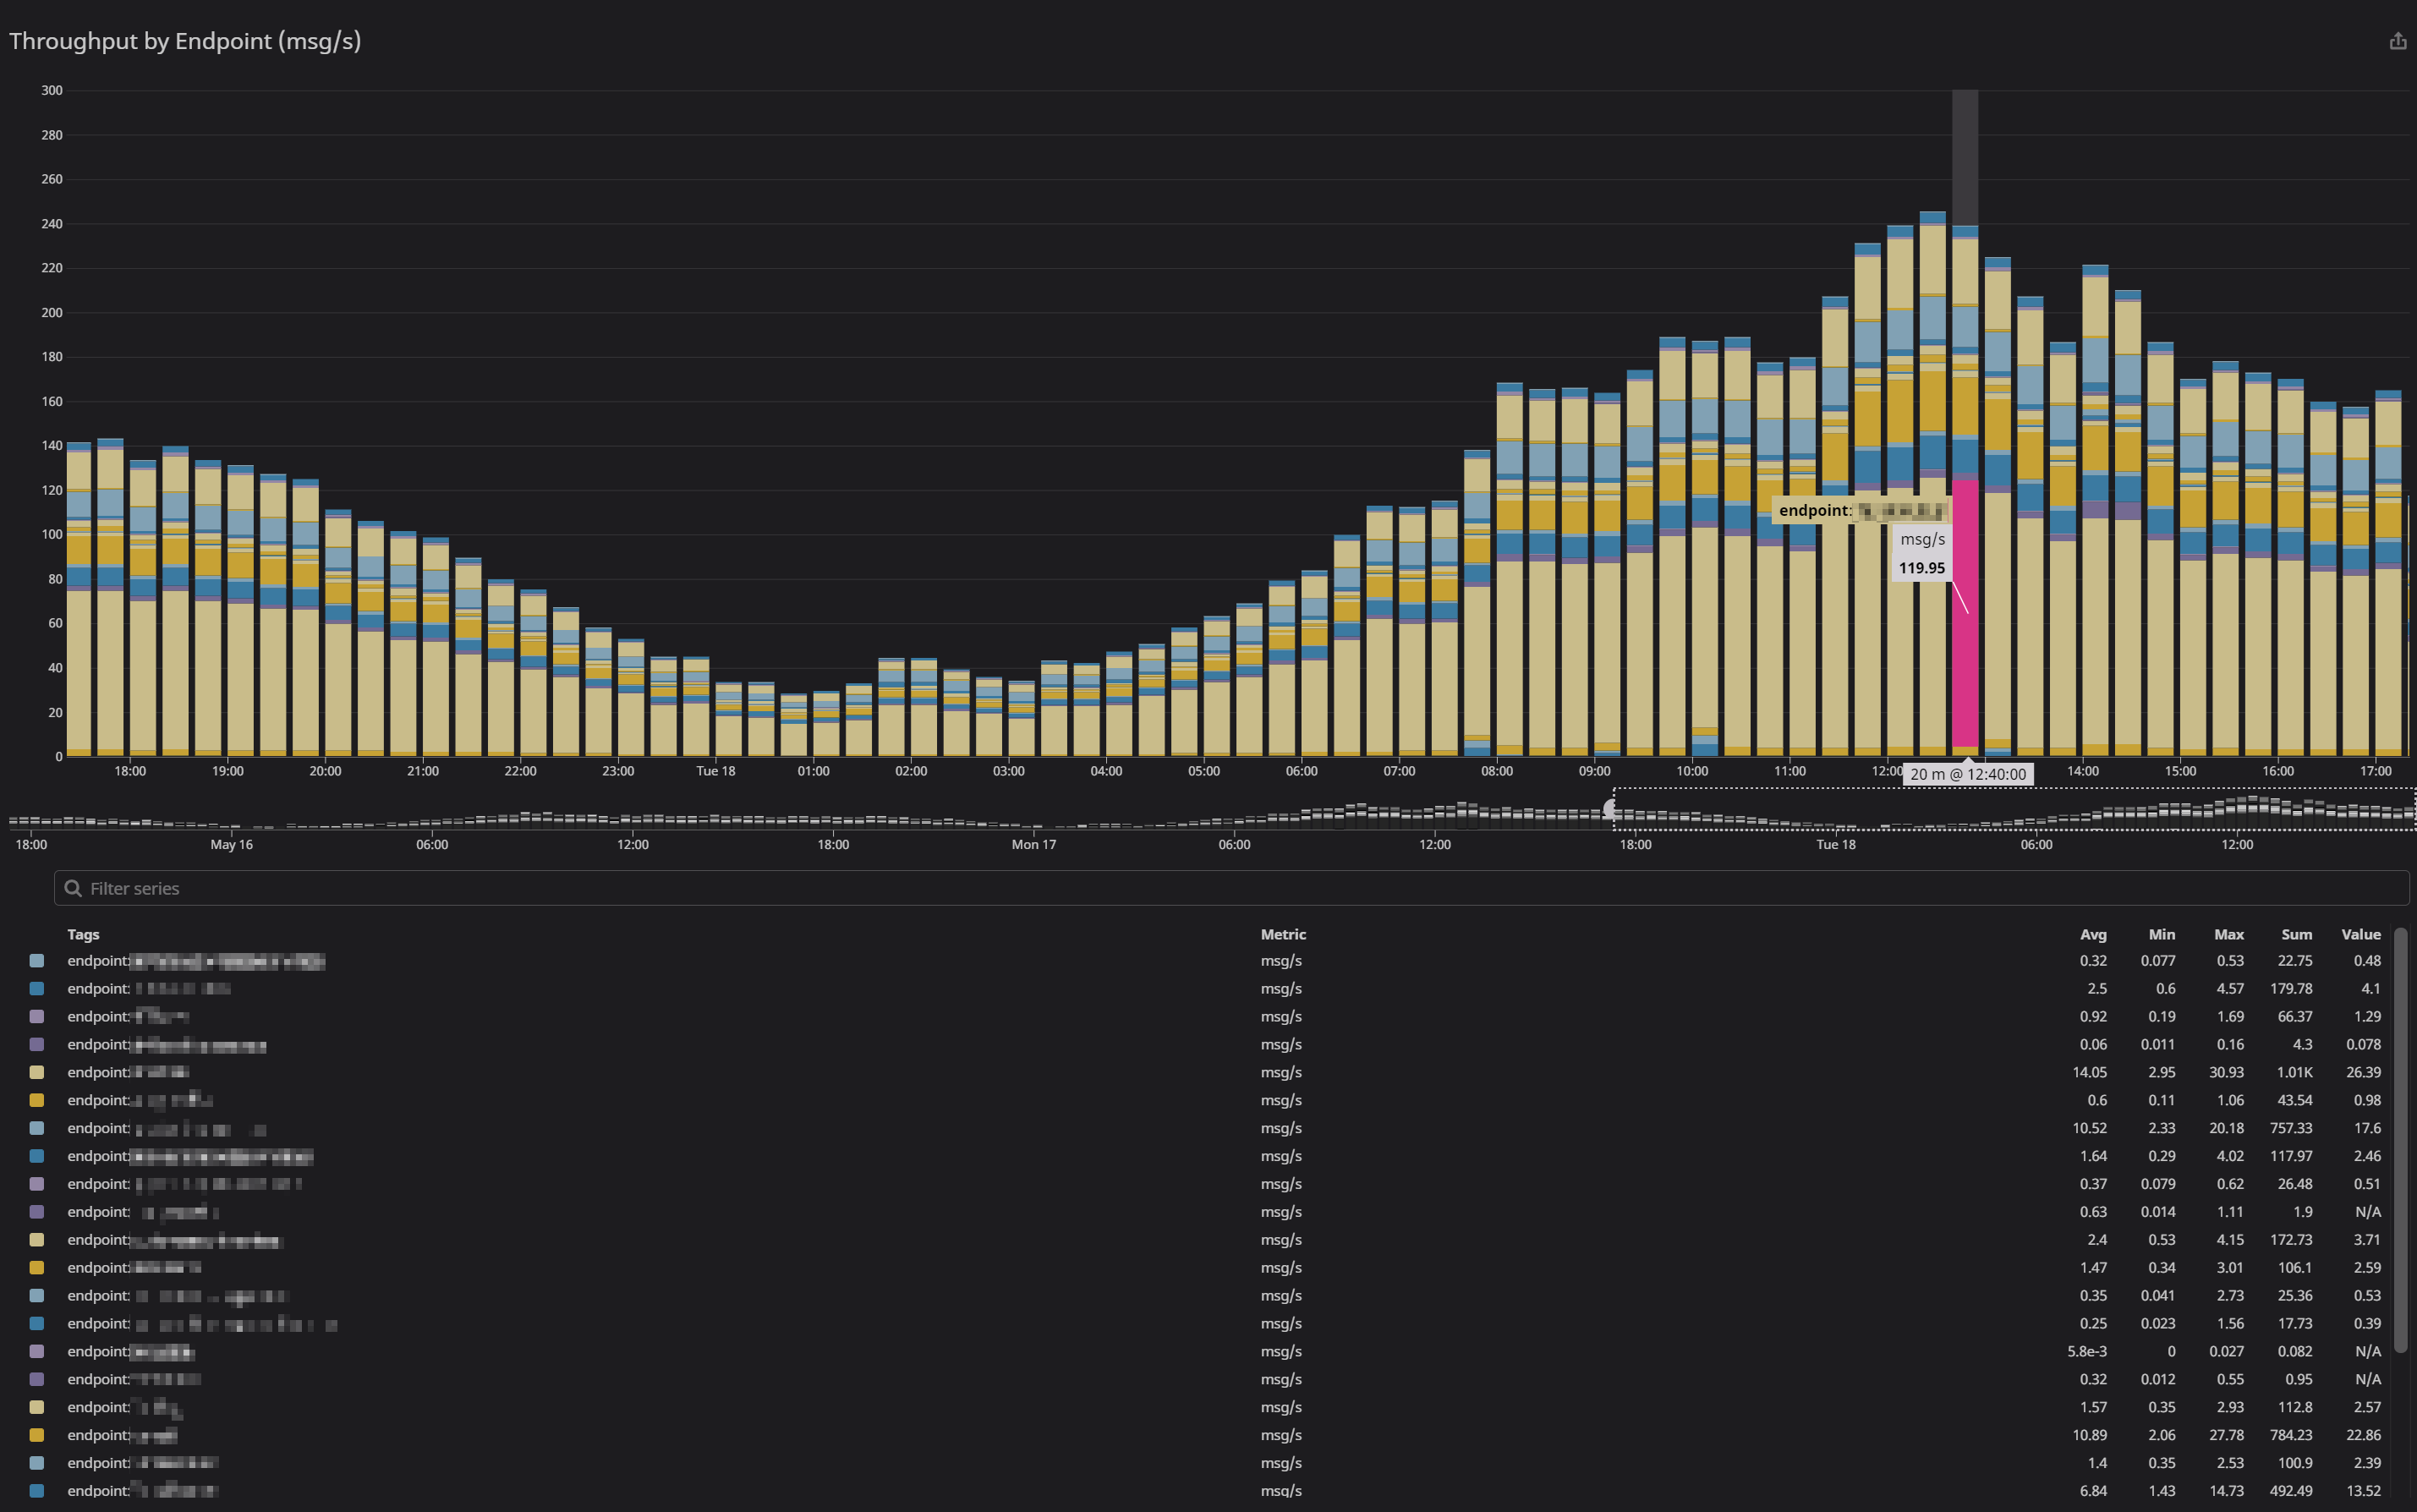
Detailed time series example
This is a zoomed-in example of a single time series component. It displays the message throughput for the entire system, with each bar color-coded by endpoint name.
Hovering over a section shows the details of the related endpoint.
e.g. sum:nservicebus.
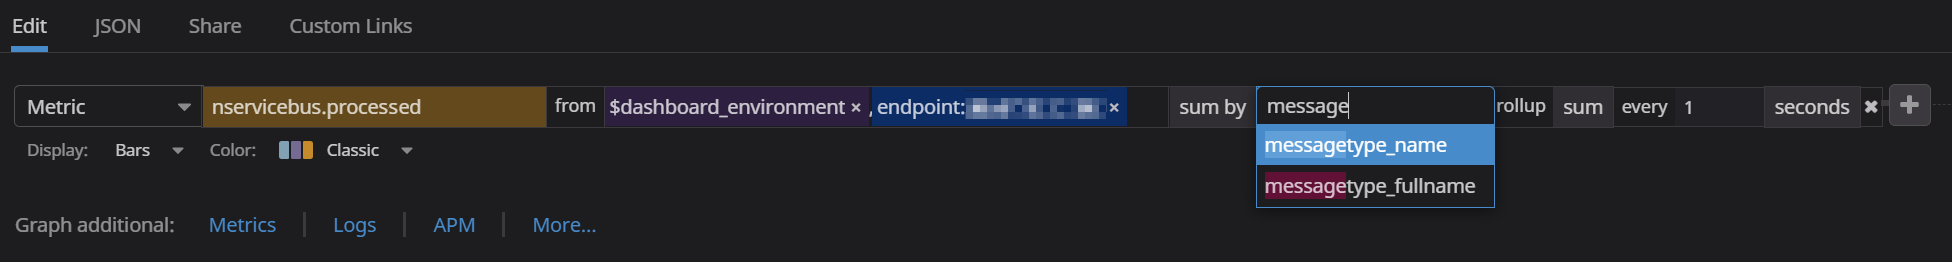
Timeseries configuration
A specific endpoint or message type for the metric can be pinpointed in the from setting, then optionally the metric can be broken down by another facet. In this example, the displayed nservicebus. metric for just the specified endpoint can then use the sum by to show individual sums by message type.