Jaeger is a distributed tracing system for monitoring and troubleshooting distributed systems. This sample demonstrates how to export OpenTelemetry traces from NServiceBus-based systems to Jaeger.
Prerequisites
A Jaeger instance is required to send, process and view OpenTelemetry trace diagnostics. Use the All in one Jaeger container image for development and testing purposes by running the following docker command:
$ docker run --name jaeger \
  -e COLLECTOR_OTLP_ENABLED=true \
  -p 16686:16686 \
  -p 4317:4317 \
  -p 4318:4318 \
  jaegertracing/all-in-one:latest
With this default configuration, the Jaeger UI will be available at http:/ and the OTEL Collector is set up to listen on the default ports: 4317 (gRPC) and 4318 (http).
Code overview
The sample contains two endpoints. The Publisher endpoint publishes events. The Subscriber event subscribes to the events and sends replies. To enable tracing and export to Jaeger, the TraceProvider for each endpoint has to be configured as follows:
var tracerProvider = Sdk.CreateTracerProviderBuilder()
    .SetResourceBuilder(ResourceBuilder.CreateDefault().AddService(EndpointName))
    .AddSource("NServiceBus.Core*")
    .AddOtlpExporter() // The exporter defaults to gRPC on over port 4317 - https://github.com/open-telemetry/opentelemetry-dotnet/blob/main/src/OpenTelemetry.Exporter.OpenTelemetryProtocol/README.md#otlpexporteroptions
    .Build();
Running the sample
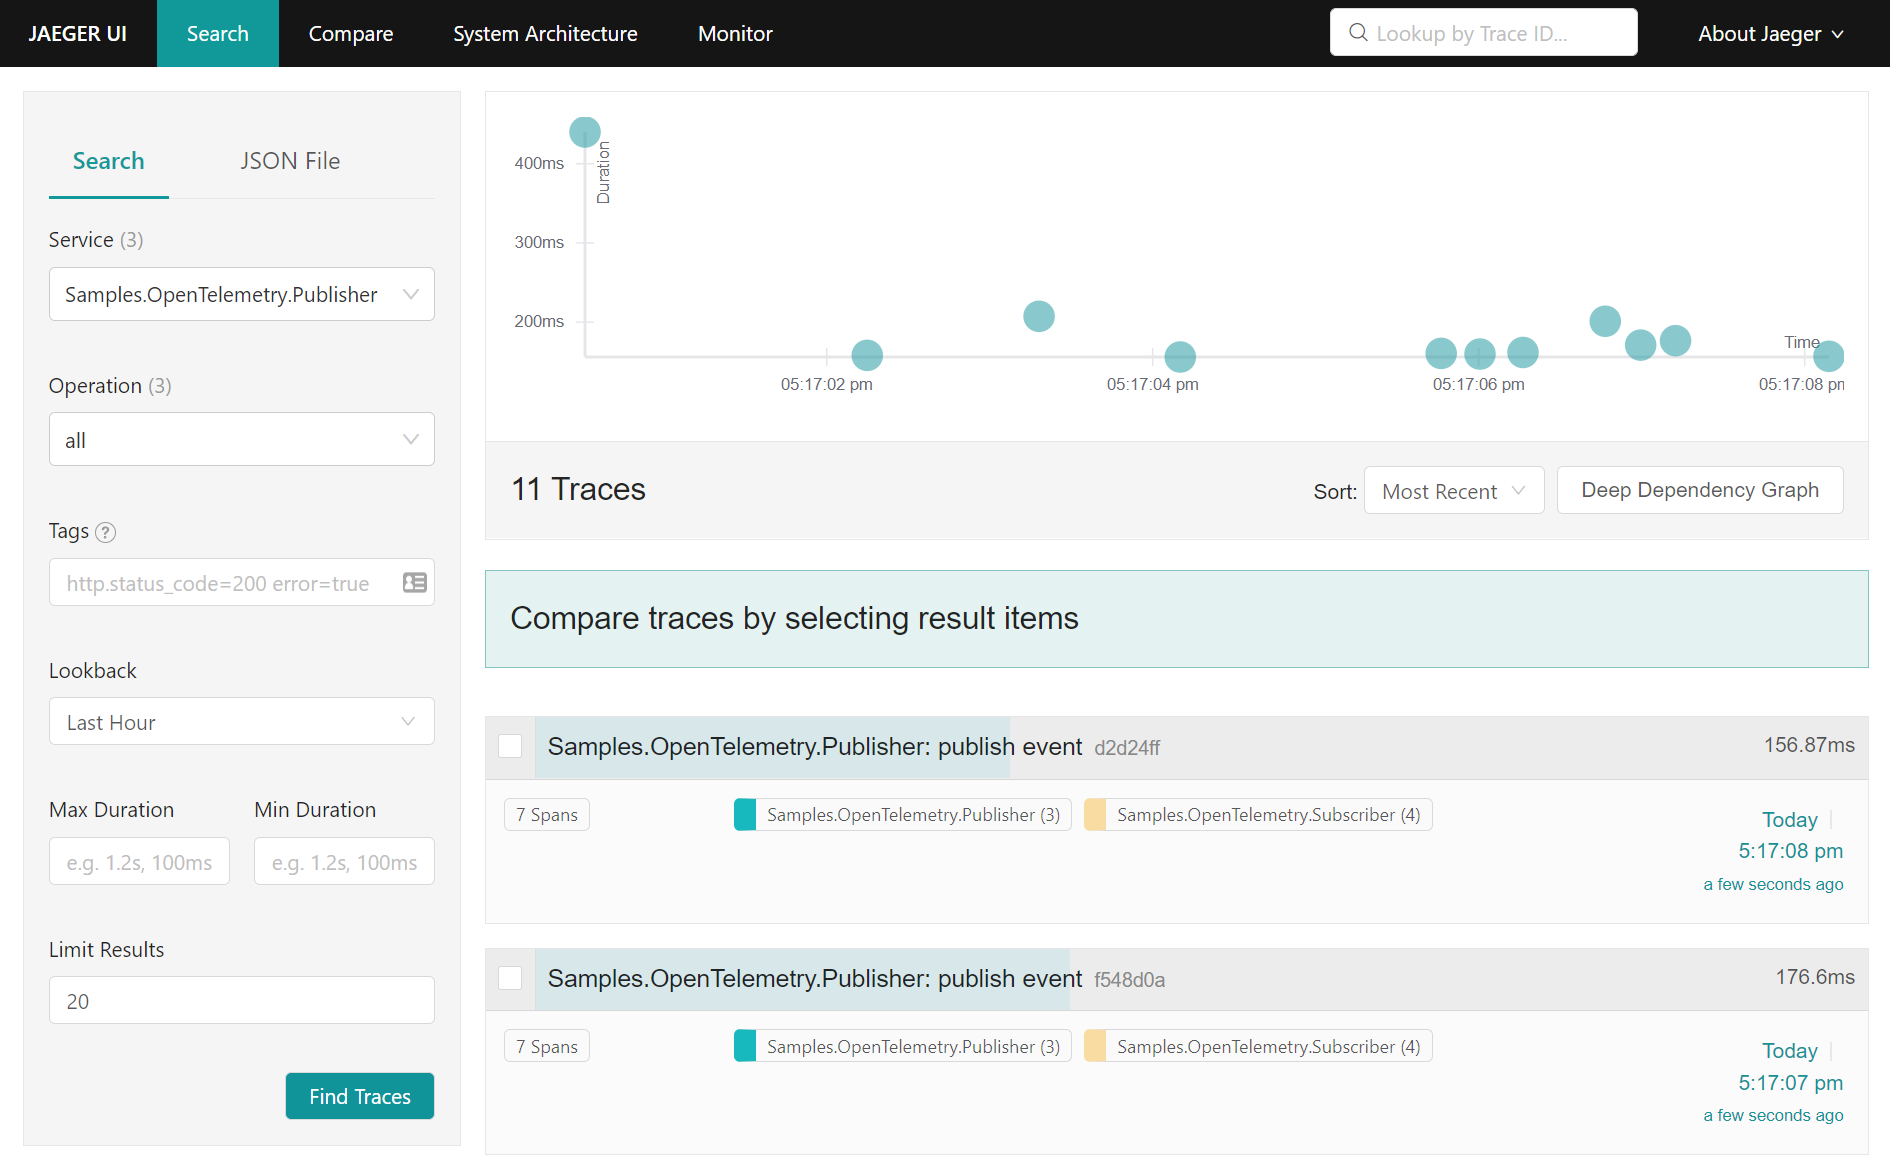
Run the sample and press 1 on the Publisher endpoint to publish one or more events. Navigate to the Jaeger UI (at http:/) to inspect the captured traces:
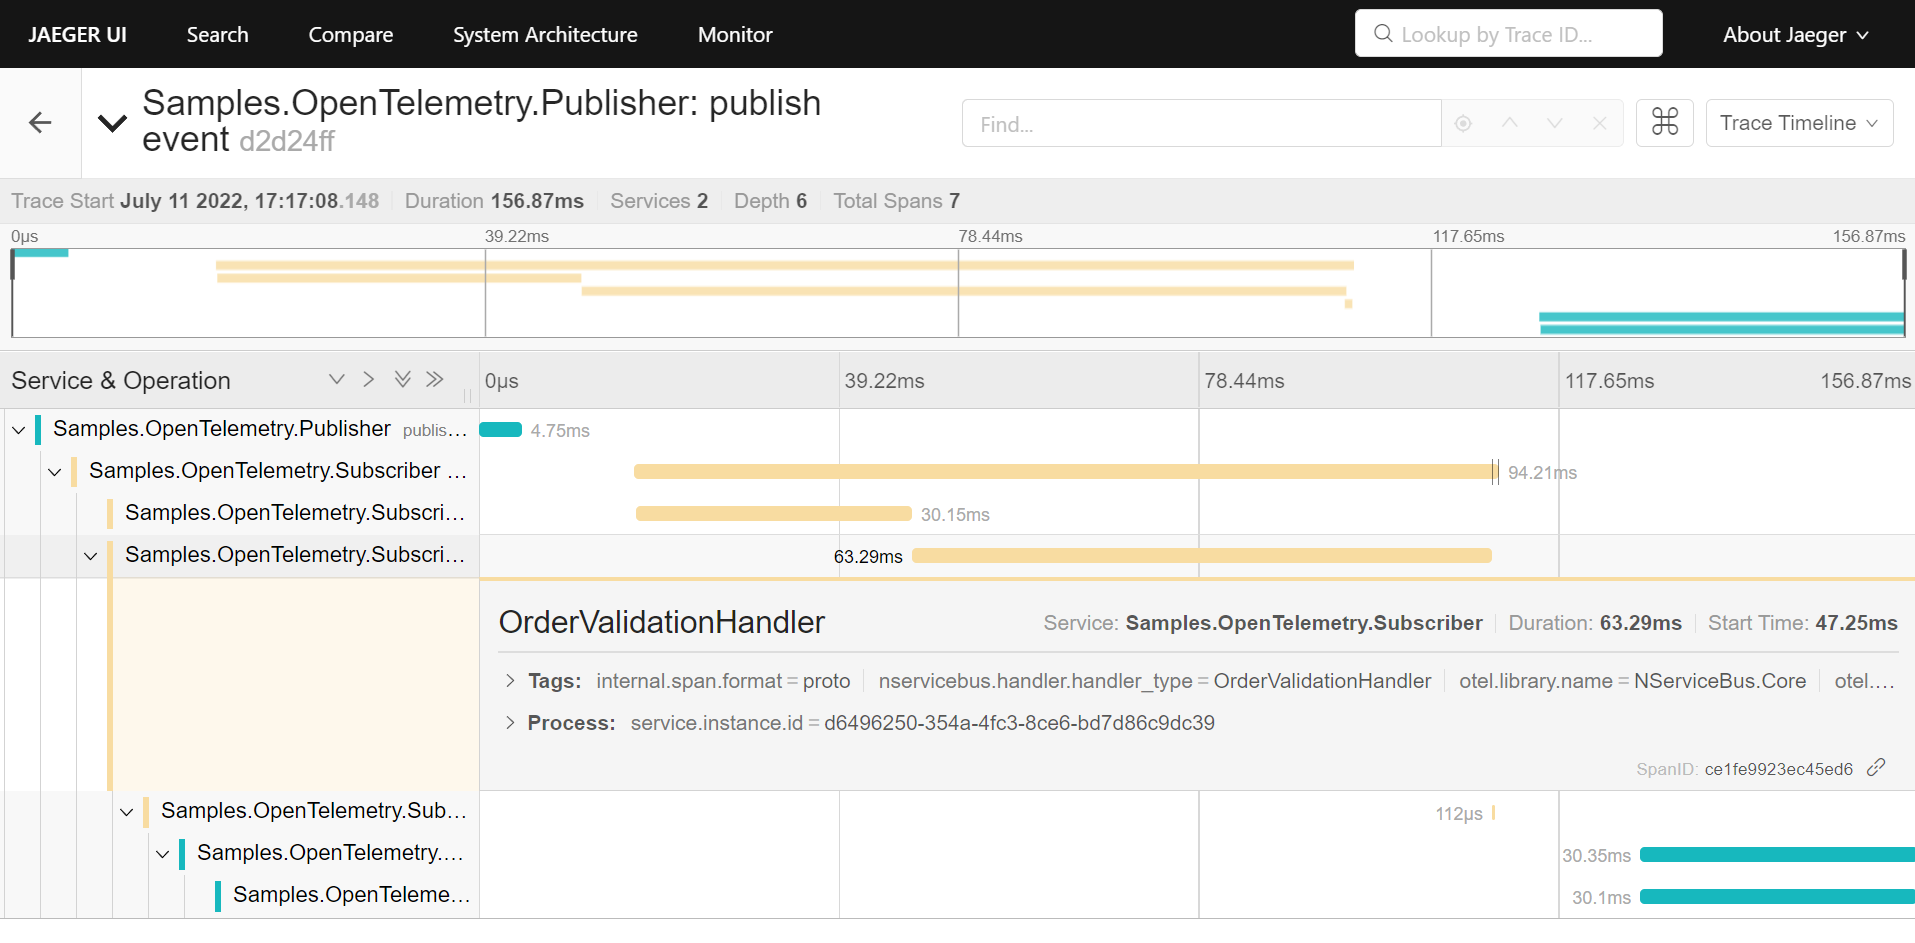
Inspecting a selected trace shows the conversation flow between the Publisher and the Subscriber endpoint: