Prometheus is a monitoring solution for storing time series data like metrics. Grafana visualizes the data stored in Prometheus (and other sources). This sample demonstrates how to capture NServiceBus OpenTelemetry metrics, store them in Prometheus, and visualize these metrics using a Grafana dashboard.
Prerequisites
To run this sample, Prometheus and Grafana are required. This sample uses Docker and a docker-compose. file to run the stack. To run the Docker stack, run docker-compose up -d in the directory where the docker-compose. file is located.
Code overview
The sample simulates message load with a random 10% failure rate using the LoadSimulator class:
var simulator = new LoadSimulator(messageSession, TimeSpan.Zero, TimeSpan.FromSeconds(10));
simulator.Start();
Reporting metric values
Opt into a specific metric, either by name or by wildcard:
var meterProviderBuilder = Sdk.CreateMeterProviderBuilder()
    .SetResourceBuilder(resourceBuilder)
    .AddMeter("NServiceBus.Core*");
Each reported metric is tagged with the following additional information:
- the queue name of the endpoint
- the uniquely addressable address for the endpoint (if set)
- the .NET fully qualified type information for the message being processed
- the exception type name (if applicable)
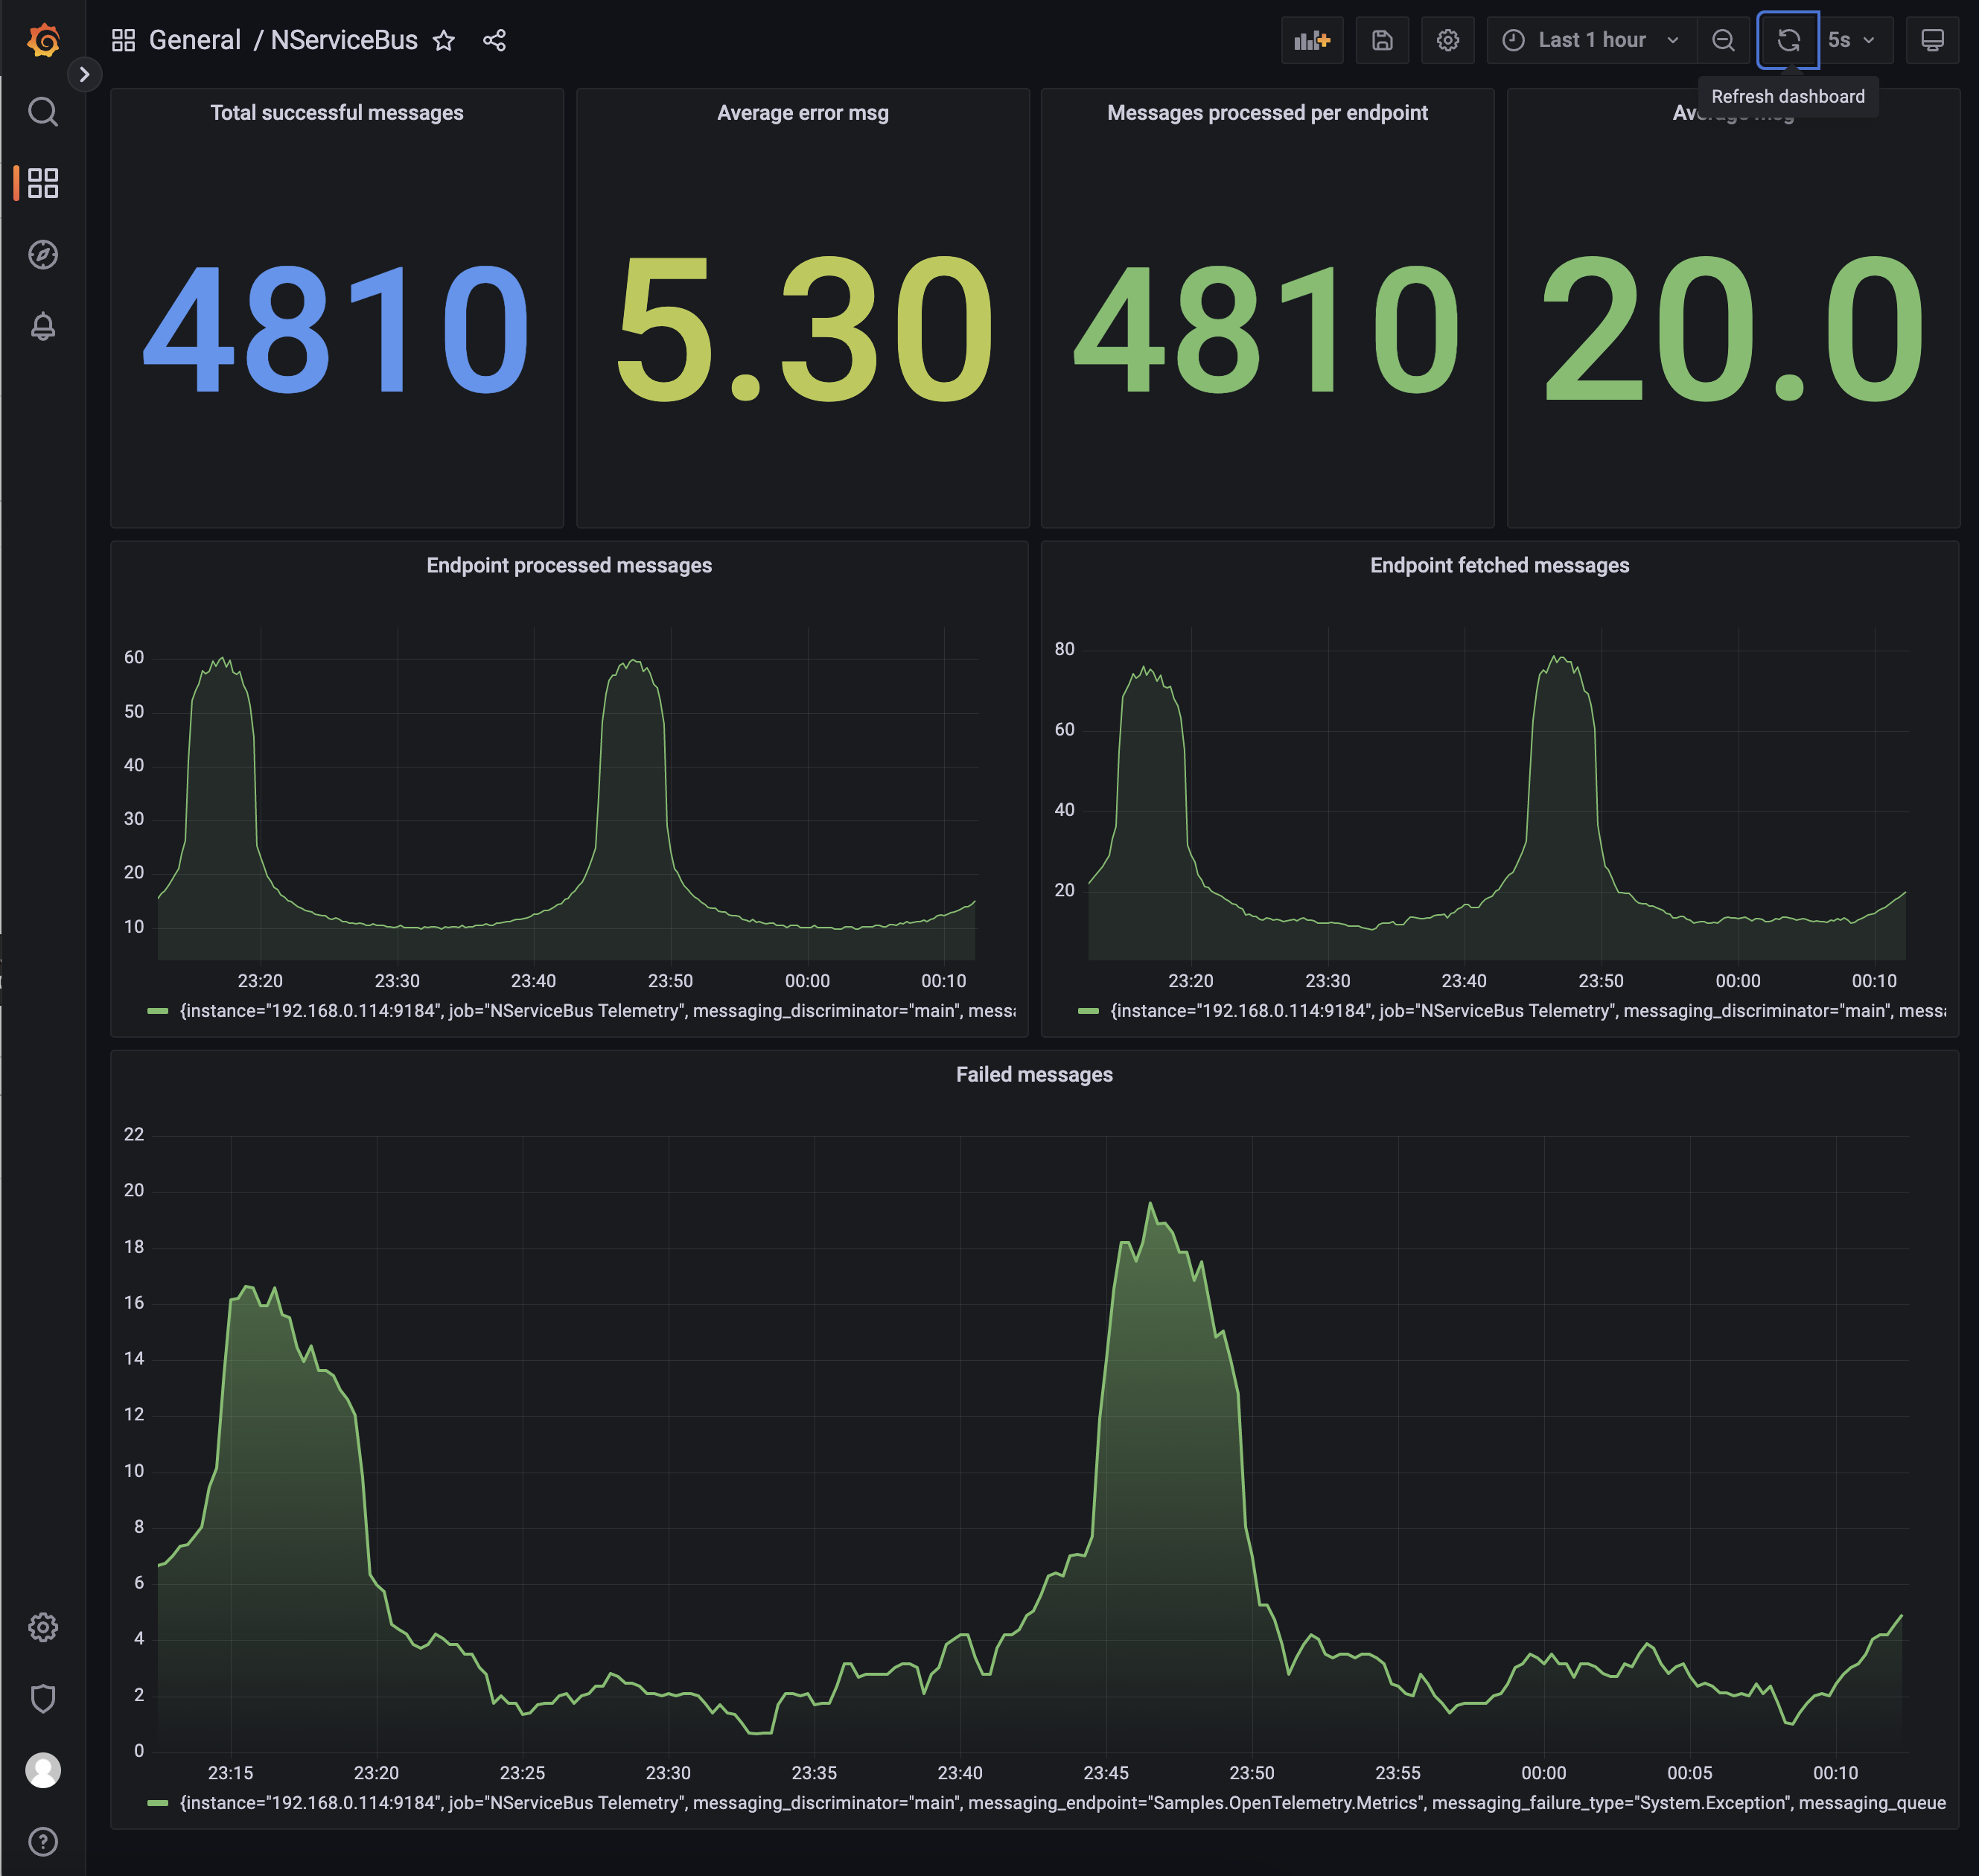
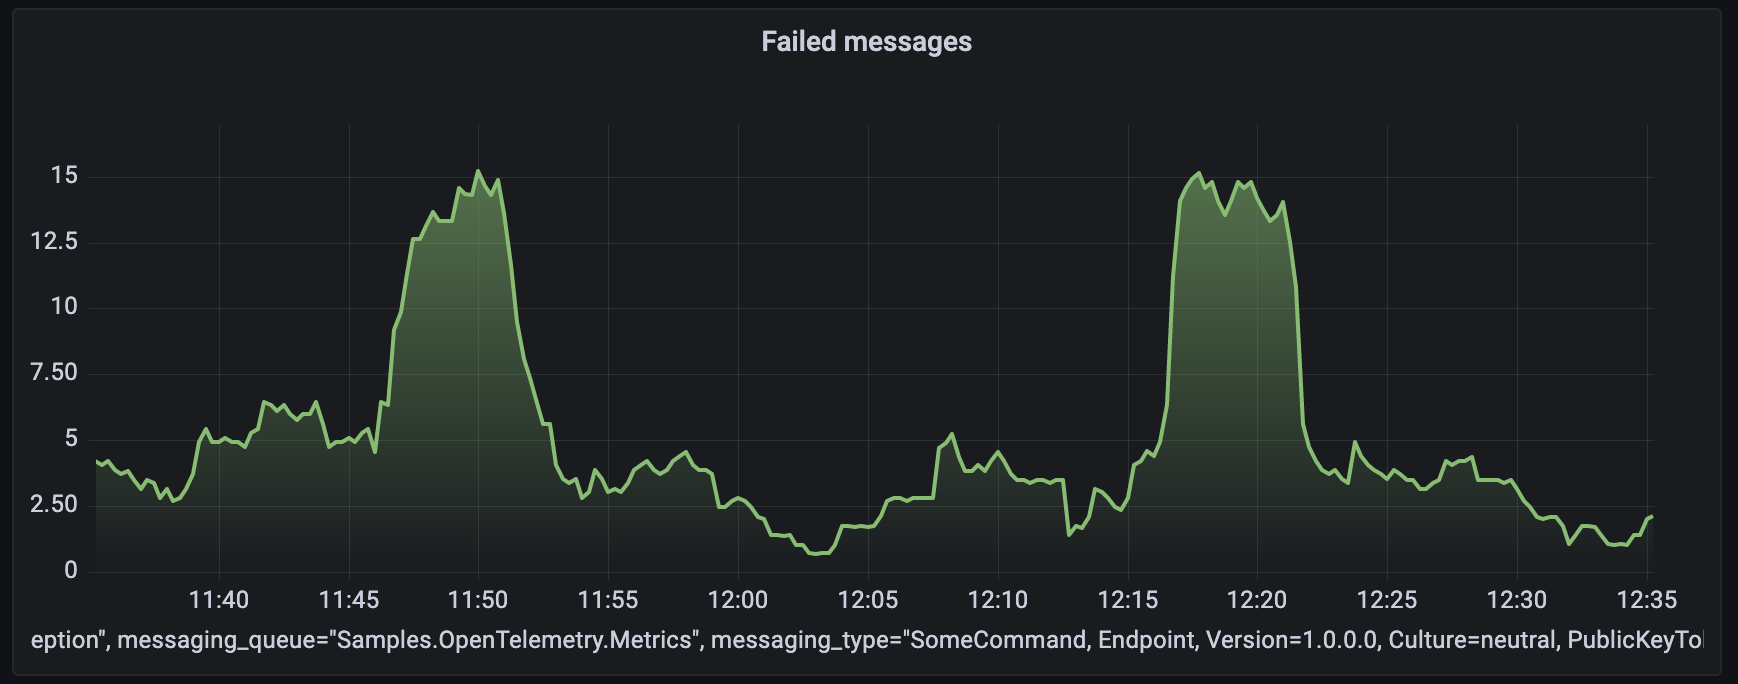
Message processing counters
The following metric keys are available to monitor the rate of messages from the queuing system use:
nservicebus.messaging. fetches nservicebus.messaging. successes nservicebus.messaging. failures
Recoverability
To monitor recoverability metrics, use:
nservicebus.recoverability. immediate nservicebus.recoverability. delayed nservicebus.recoverability. error
Handler time, critical time, and processing time
To monitor handler time, processing time, and critical time (in seconds) for successfully processed messages use:
nservicebus.messaging. handler_time nservicebus.messaging. processing_time nservicebus.messaging. critical_time
Exporting metrics
The metrics are gathered using OpenTelemetry standards on the endpoint and must be reported and collected by an external service. A Prometheus HTTP listener exposes this data so the Prometheus service, hosted as a docker service, can retrieve and store this information.
The listener is available via the OpenTelemetry. NuGet package. In this sample, the service that exposes the data to scrape is hosted on http:/, allowing the Prometheus service running in Docker to reach it via host.:
meterProviderBuilder.AddPrometheusHttpListener();
The raw metrics retrieved through the scraping endpoint look as follows:
# HELP nservicebus_messaging_successes Total number of messages processed successfully by the endpoint.
# TYPE nservicebus_messaging_successes counter
nservicebus_messaging_successes{nservicebus_discriminator="main",nservicebus_message_type="SomeCommand, Endpoint, Version=1.0.0.0, Culture=neutral, PublicKeyToken=null",nservicebus_queue="OpenTelemetryDemo"} 850 1657693075515

# HELP nservicebus_messaging_fetches Total number of messages fetched from the queue by the endpoint.
# TYPE nservicebus_messaging_fetches counter
nservicebus_messaging_fetches{nservicebus_discriminator="main",nservicebus_message_type="SomeCommand, Endpoint, Version=1.0.0.0, Culture=neutral, PublicKeyToken=null",nservicebus_queue="OpenTelemetryDemo"} 1060 1657693075515

# HELP nservicebus_messaging_failures Total number of messages processed unsuccessfully by the endpoint.
# TYPE nservicebus_messaging_failures counter
nservicebus_messaging_failures{nservicebus_discriminator="main",nservicebus_failure_type="System.Exception",nservicebus_message_type="SomeCommand, Endpoint, Version=1.0.0.0, Culture=neutral, PublicKeyToken=null",nservicebus_queue="OpenTelemetryDemo"} 210 1657693075515
The diagram below shows the overall component interactions:
Docker stack
In a production environment, the Prometheus service must be configured to retrieve the metrics data from the endpoint. Grafana must also be configured to get the data from Prometheus and visualize it as graphs. For this sample both services are setup as part of the Docker stack
Show a graph
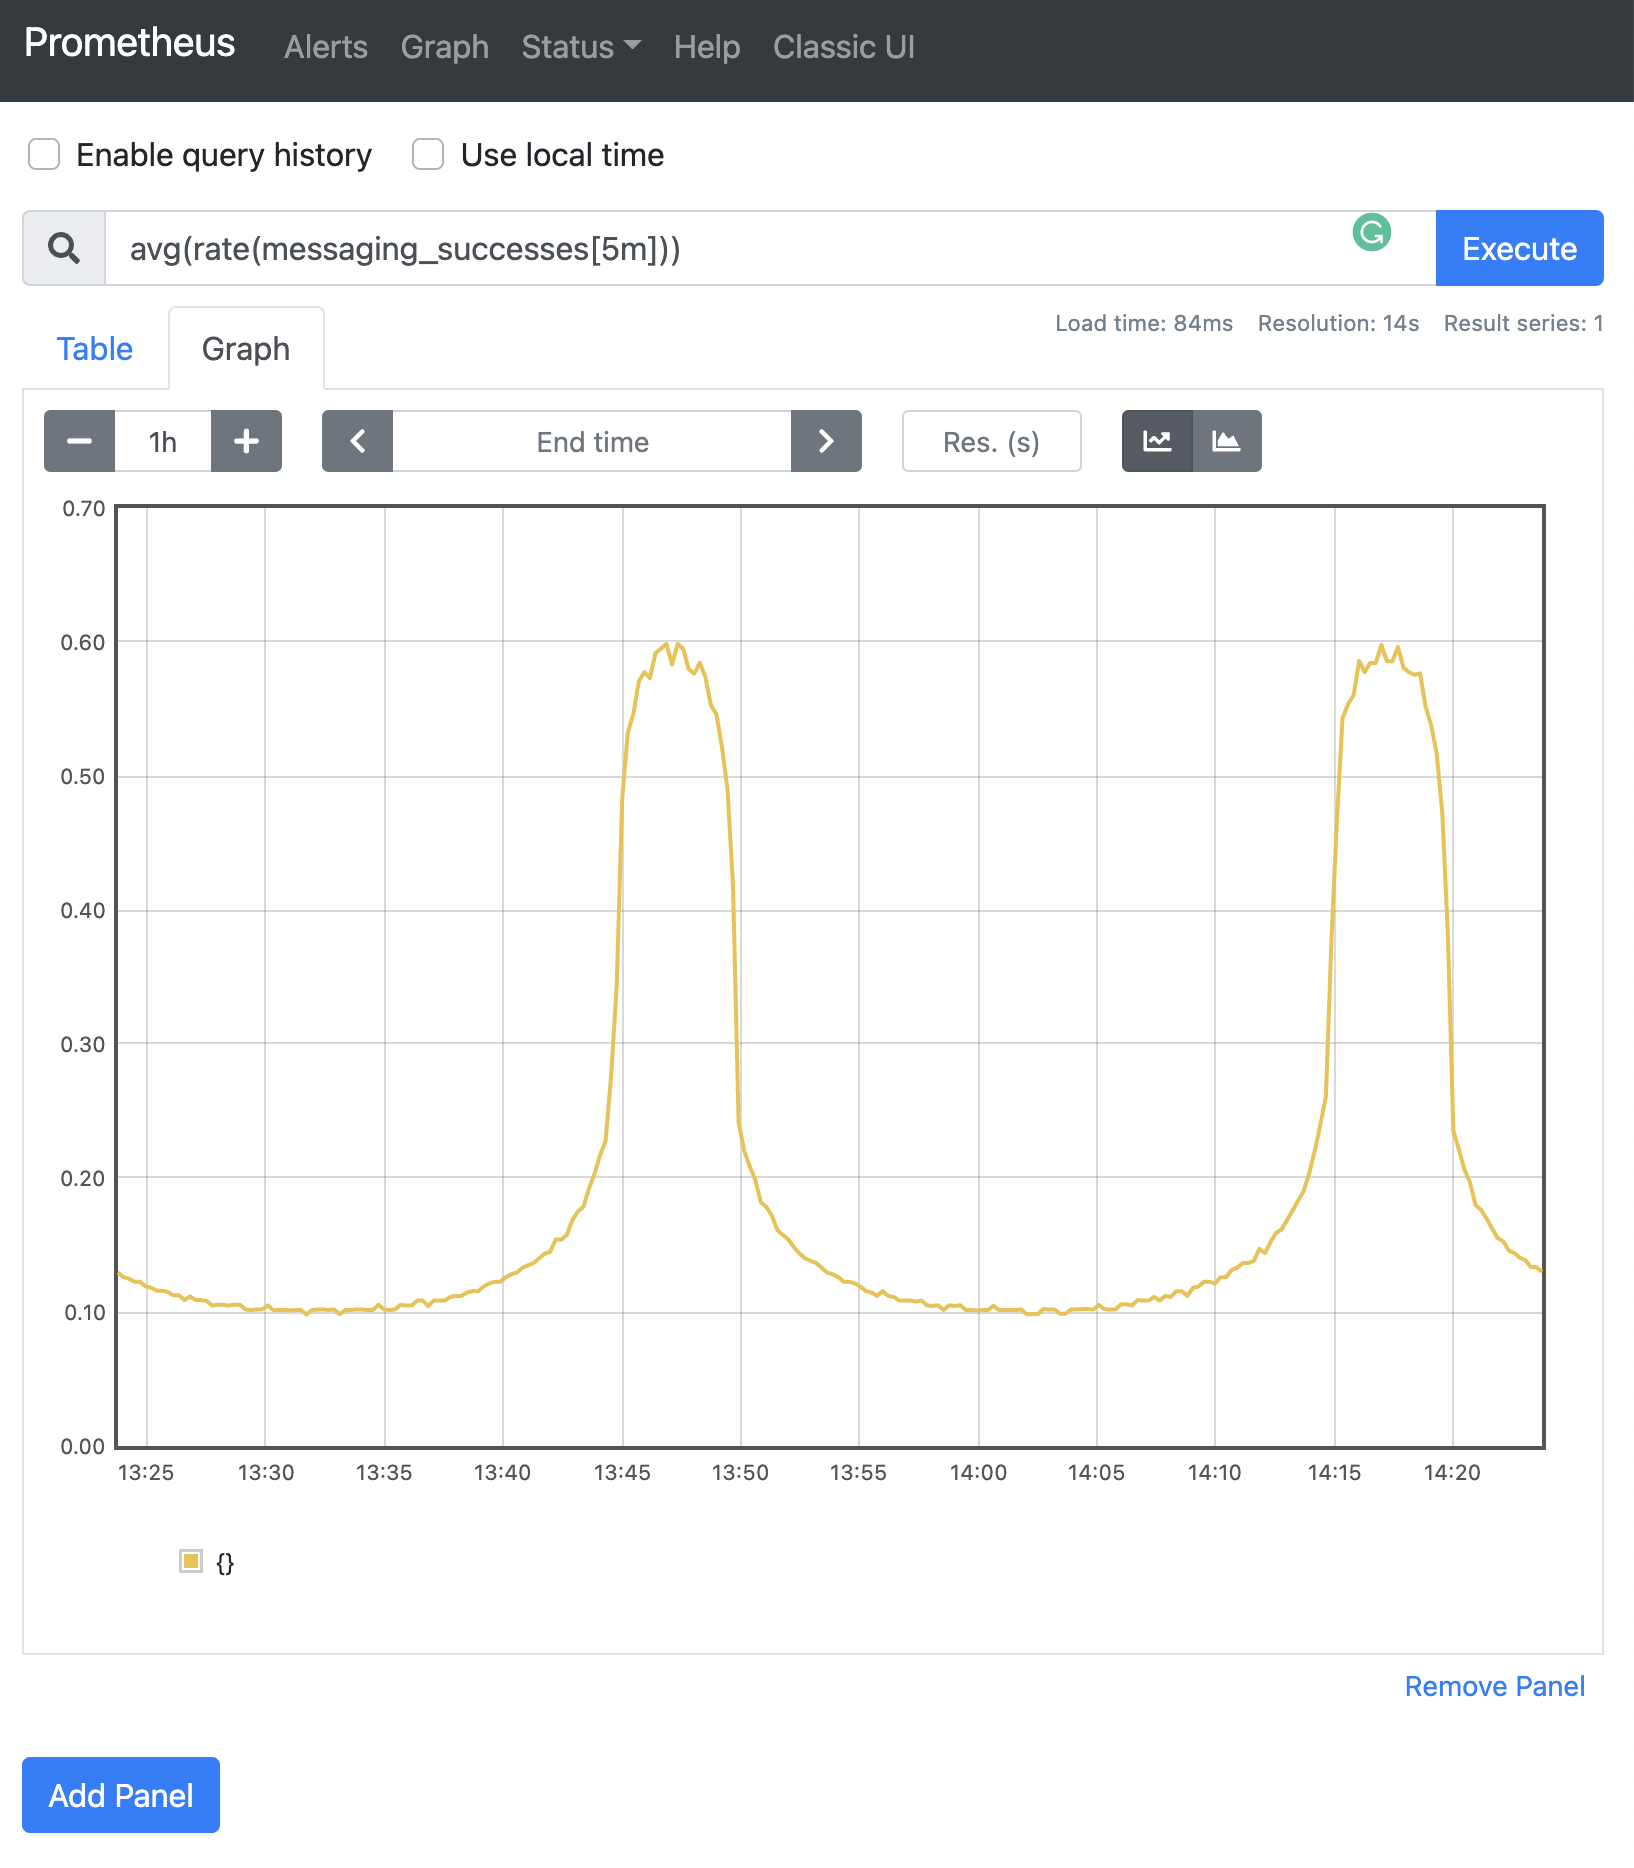
Open Prometheus on http:/.
NServiceBus pushes events for success, failure, and fetched. These events must be converted to rates by a query. For example, the nservicebus_messaging_successes_total metric can be queried as:
avg(rate(nservicebus_messaging_successes_total[5m]))
Grafana
Open Grafana on http:/, which is made available as part of the Docker stack
For a production environment, Grafana must be installed and configured to display the data scraped and stored in Prometheus. For more information on how to install Grafana, refer to the Grafana installation guide.
Dashboard
This sample includes an export of the Grafana dashboard which can be imported as a reference.
To create a custom dashboard using Prometheus data, the following steps must be performed:
- Add a new dashboard
- Add a graph
- Click its title to edit
- From the Data source dropdown, select Prometheus
- For the query, open the Metrics dropdown and select one of the metrics. Built-in functions (e.g. rate) can also be applied.