Prerequisites
Install the counters according to the performance counters documentation.
Enabling Counters For The Endpoint
Both the SLA and Critical Time counters are enabled and configured in code.
var performanceCounters = endpointConfiguration.EnableWindowsPerformanceCounters();
performanceCounters.EnableSLAPerformanceCounters(TimeSpan.FromSeconds(100));
The other counters are enabled by default.
Regardless of whether the SLA and Critical Time counters are enabled, all endpoints must be restarted after installing the counters to start collecting the counter data.
The Handler
The handler has a random delay in achieving some fake load. The maximum random number is greater than the above-configured SLA value to cause SLA violations occasionally.
public class MyHandler(ILogger<MyHandler> logger) : IHandleMessages<MyMessage>
{
    public async Task Handle(MyMessage message, IMessageHandlerContext context)
    {
        var sleepTime = Random.Shared.Next(1, 1000);
        await Task.Delay(sleepTime, context.CancellationToken);
        logger.LogInformation("Hello from MyHandler. Slept for {SleepTime} ms", sleepTime);
    }
}
Run Solution
Run the solution so that the Performance Counter instances are registered.
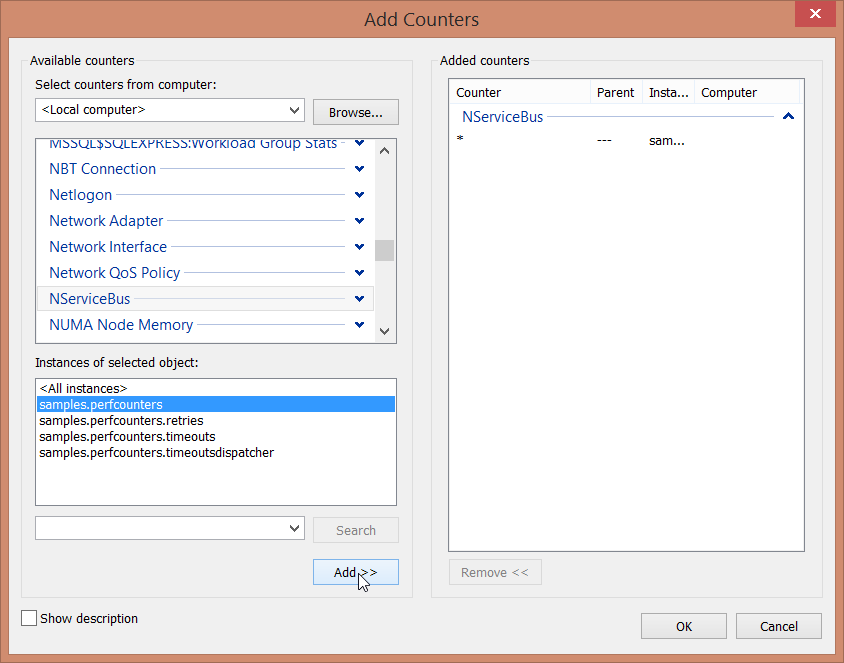
Add Counters in Performance Monitor
- Start Windows Performance Monitor.
- Clear the default counters by clicking the red
xbutton above the performance monitor graph. - Add the NServiceBus Counters by clicking the green
+button above the performance monitor graph.
Send Messages
Send any number of messages and watch the effect on the specific Performance Counters.
The sending code in Program. is set to send ten messages at a time.
Performance Counters Analysis
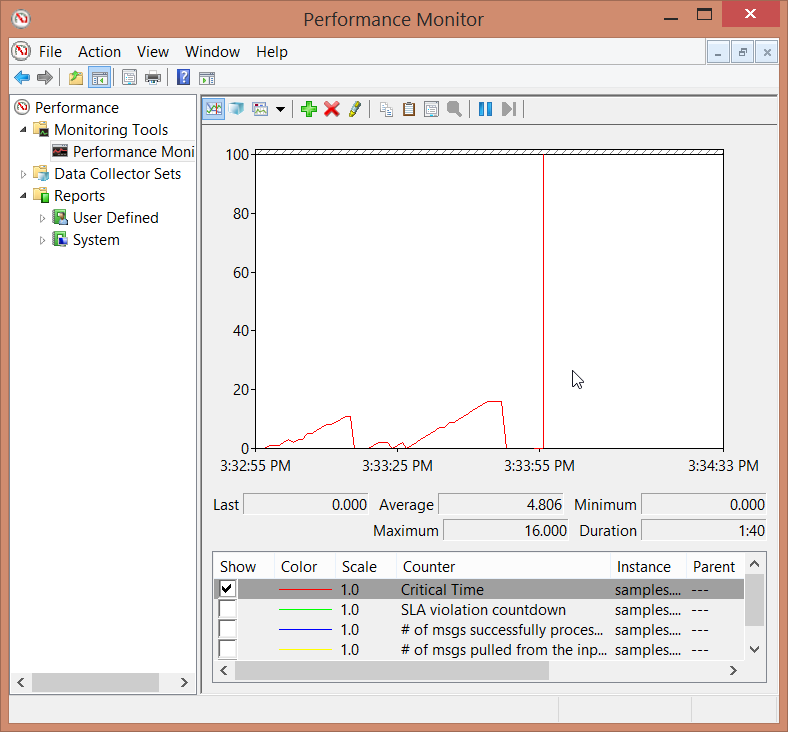
Critical Time
Continually sending more messages will cause the load on the endpoint to increase. This will eventually result in a back-logged queue. Messages will spend longer in the queue resulting in a gradual increase in Critical Time. Stop sending messages, and eventually, the endpoint will catch up, causing the Critical Time to drop back to zero.
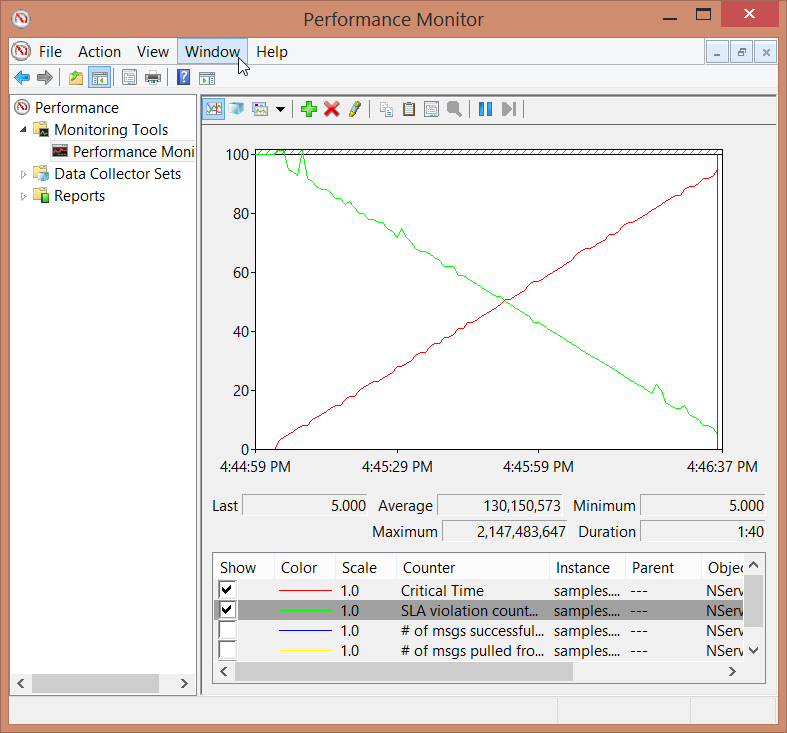
SLA Violation Countdown
The SLA Violation Countdown is the number of seconds left until the SLA for the particular endpoint is breached, so effectively, this is an inverse counter. When messages are sent continually, the Critical Time will increase while the SLA Violation Countdown will decrease.
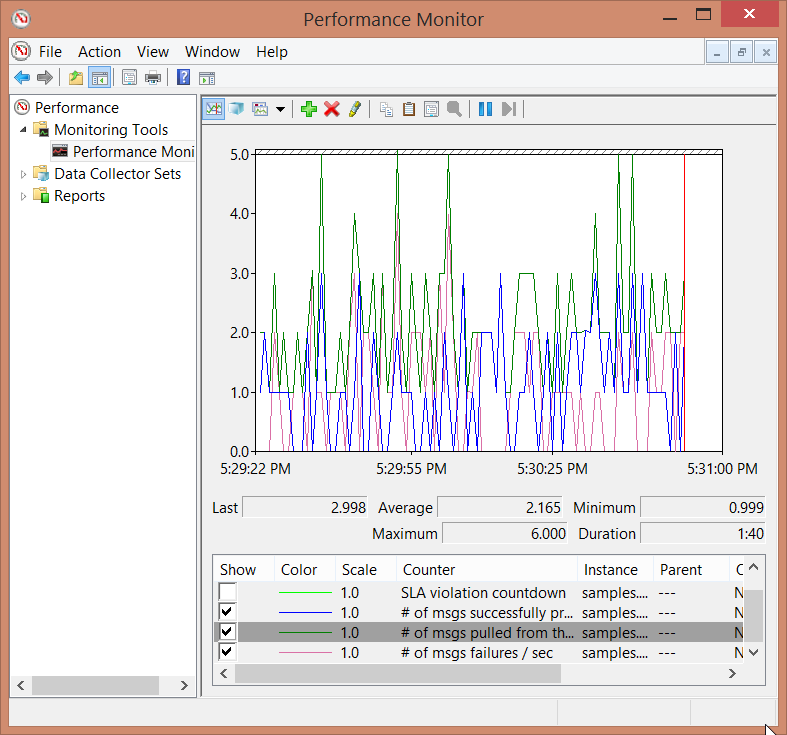
Other counters
To visualize both success and failures in the same view, change the handler code to the following.
var sleepTime = random.Next(1, 1000);
await Task.Delay(sleepTime, context.CancellationToken);
if (sleepTime % 2 != 0)
{
    throw new Exception();
}
log.Info($"Hello from MyHandler. Slept for {sleepTime} ms");
Run the endpoint and send some messages and monitor the results of all the performance counters.