This document describes the settings required for collecting usage data to generate a usage report.
The usage data collection functionality requires ServicePulse version 1.40 or later, and ServiceControl version 5.4 or later.
Connection setup
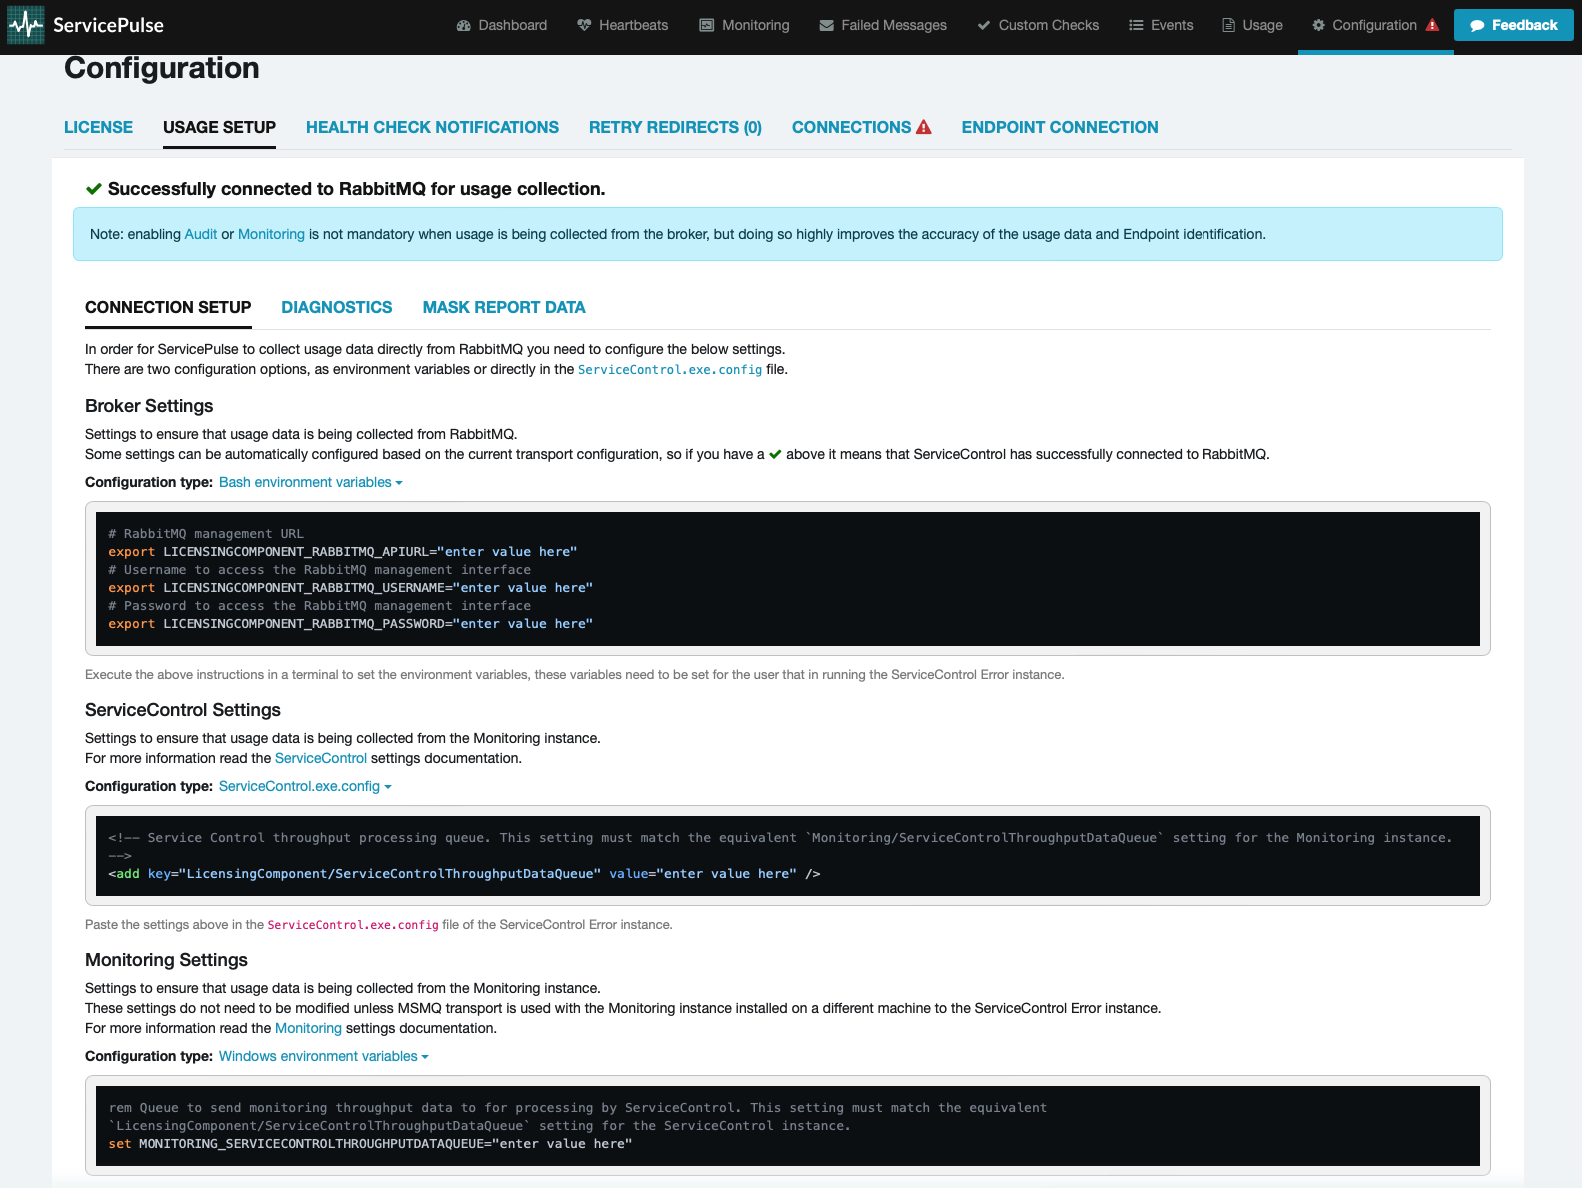
In most scenarios existing ServiceControl error instance connection settings will be used to establish a connection to the broker.
If there is a connection problem, specific usage settings can be provided as environment variables or directly in the ServiceControl.exe.config file. The Usage Setup tab provides easy copy/paste functionality to obtain the required settings in the correct format, based on configuration type.
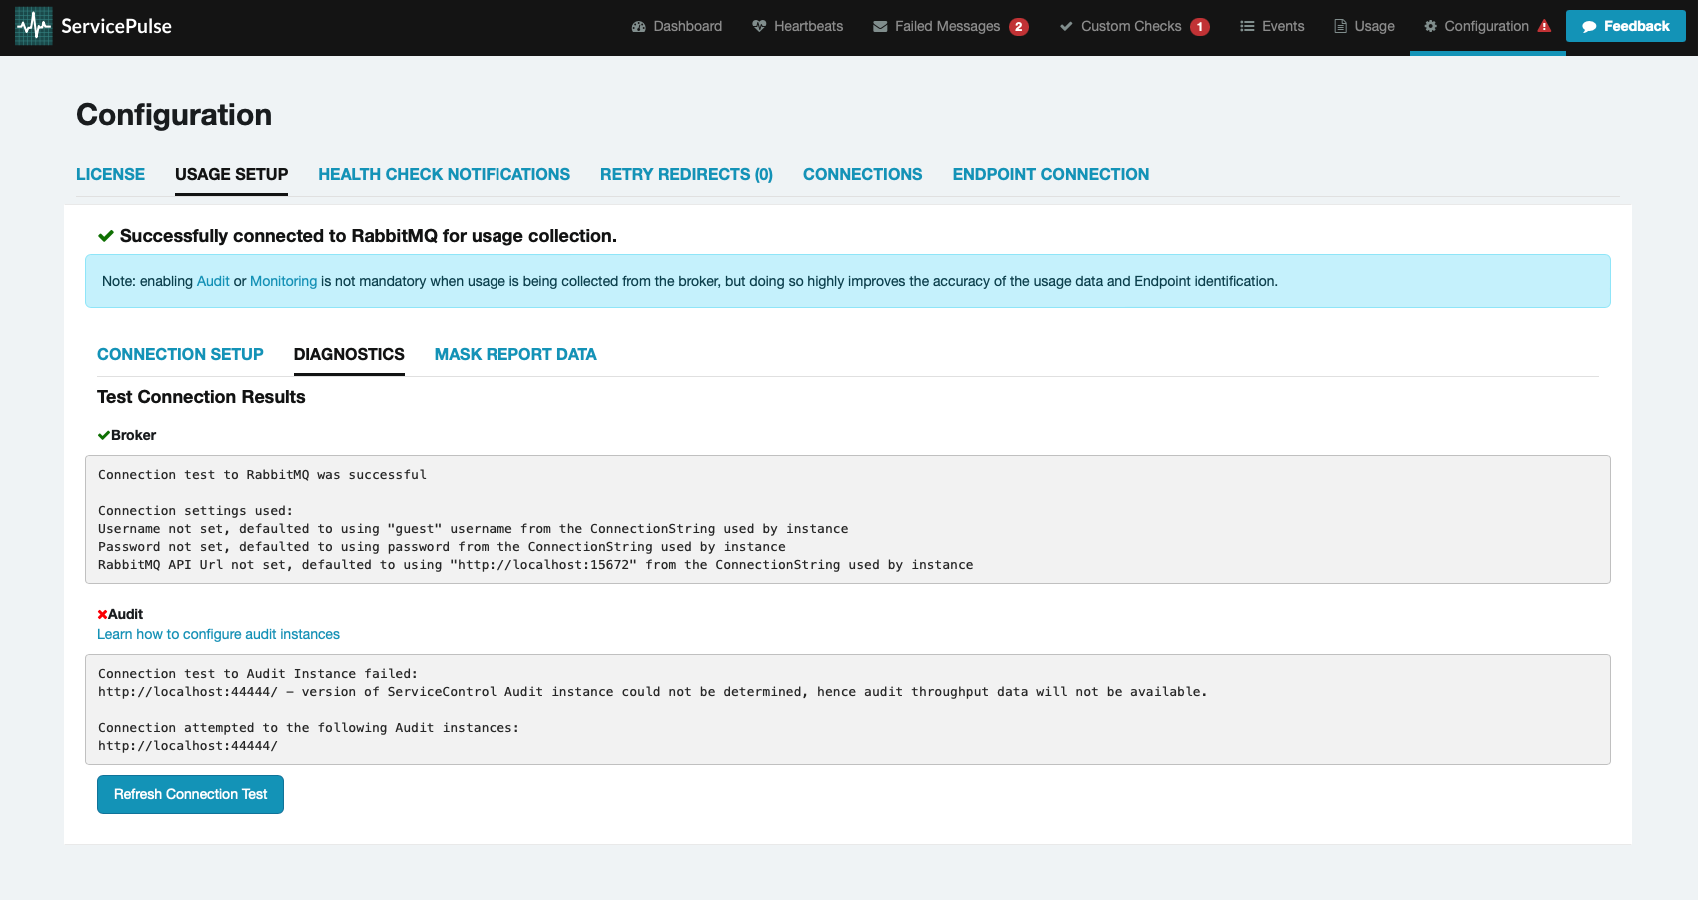
Refer to the Diagnostics tab to diagnose connection issues.
Azure Service Bus
Steps:
- Create an ApplicationId (aka ClientId) for ServiceControl
- Assign it the Monitoring Reader role
- Configure for the ServiceControl instance at minimum:
TenantIdSubscriptionIdClientIdClientSecret
Using Azure Portal
To use the Azure Portal, follow these instructions. Alternatively, use the Azure CLI as described below.
- Create App
- Native to: Home > App registrations
- Select ➕ New registration
- Assign application to role:
- Navigate to: Home > Service Bus > > Access control (IAM)
- Select: ➕ Add
- Enter:
- Role:
Monitoring Reader - Members: Select ➕ Select Members >
- Role:
- Select: Review and Assign
Using Azure CLI
To use the Azure CLI or scripting, follow these instructions. Alternatively, use the Azure Portal as described above.
# Set context first
az account set --subscription "YourAzureSubscriptionName"

# Create ApplicationId (ClientId)
az ad app create --display-name ServiceControlUsageReporting

# Store your ApplicationId (ClientId)
$applicationId = "<Your Application ID>"

# List subscription ID
az servicebus namespace list

# Store your Subscription ID
$subscriptionId = "<Your Subscription ID>"

# List resource group
az group list

# Store resource group name
$resourceGroupName = "<Your Resource Group Name>"

# Assign role to resource group
$scope = "/subscriptions/$subscriptionId/resourceGroups/$resourceGroupName"

# or to specific resource in resource group
$scope = "/subscriptions/$subscriptionId/resourceGroups/$resourceGroupName/providers/Microsoft.ServiceBus/namespaces/$namespaceName"
# end alternative

# assign Monitoring Reader role to ApplicationId
New-AzRoleAssignment -ApplicationId $applicationId -RoleDefinitionName "Monitoring Reader" -Scope $scope
Settings
Refer to the Usage Reporting when using the Azure Service Bus transport section of the ServiceControl config file for an explanation of the Azure Service Bus-specific settings.
Minimum Permissions
The built-in role Monitoring Reader is sufficient to access the required Azure Service Bus metrics.
To restrict permissions to the minimal required set, create a custom role with the following permissions:
{
    "properties": {
        "roleName": "myrolename",
        "description": "",
        "assignableScopes": [
            "/subscriptions/xxxxxxxxxxxxxxxxxxxxx"
        ],
        "permissions": [
            {
                "actions": [
                    "Microsoft.ServiceBus/namespaces/read",
                    "Microsoft.ServiceBus/namespaces/providers/Microsoft.Insights/metricDefinitions/read",
                    "Microsoft.ServiceBus/namespaces/queues/read",
                    "Microsoft.Resources/subscriptions/read",
                    "Microsoft.Resources/subscriptions/resources/read"
                ],
                "notActions": [],
                "dataActions": [],
                "notDataActions": []
            }
        ]
    }
}
The Microsoft. permissions are required to read queue names and metric data from Azure Monitor. The Microsoft. permissions are required in order to locate the Service Bus namespace within the Azure subscription.
Amazon SQS
Settings
Refer to the Usage Reporting when using the Amazon SQS transport section of the ServiceControl config file for an explanation of the Amazon SQS-specific settings.
Minimum Permissions
{
    "Version": "2012-10-17",
    "Statement": [
        {
            "Sid": "VisualEditor0",
            "Effect": "Allow",
            "Action": "cloudwatch:GetMetricStatistics",
            "Resource": "*"
        },
        {
            "Sid": "VisualEditor1",
            "Effect": "Allow",
            "Action": "sqs:ListQueues",
            "Resource": "*"
        }
    ]
}
SQLServer
Settings
Refer to the Usage Reporting when using the SqlServer transport section of the ServiceControl config file for an explanation of the SQL Server-specific settings.
Minimum Permissions
User with rights to query [INFORMATION_SCHEMA].[COLUMNS] table.
PostgreSQL
Settings
Refer to the Usage Reporting when using the PostgreSQL transport section of the ServiceControl config file for an explanation of the PostgreSQL Server-specific settings.
Minimum Permissions
User with rights to query [INFORMATION_SCHEMA].[COLUMNS] table.
RabbitMQ
Settings
Refer to the Usage Reporting when using the RabbitMQ transport section of the ServiceControl config file for an explanation of the RabbitMQ-specific settings.
Minimum permissions
User with monitoring tag and read permission.
MSMQ & Azure Storage Queues
MSMQ and Azure Storage Queues do not support querying of metrics. To enable the automatic usage reporting functionality for these systems, auditing and/or monitoring must be set up:
- Auditing
- Monitoring
- install the Monitoring instance
- configure metrics on all NServiceBus endpoints
Diagnostics
The Diagnostics tab helps to diagnose any connection issues to the broker, as well as the audit and monitoring instances.
After making any setting changes, press the Refresh Connection Test button to verify whether the problem is resolved. If unable to resolve the issue, open a non-critical support case and include the diagnostic output.
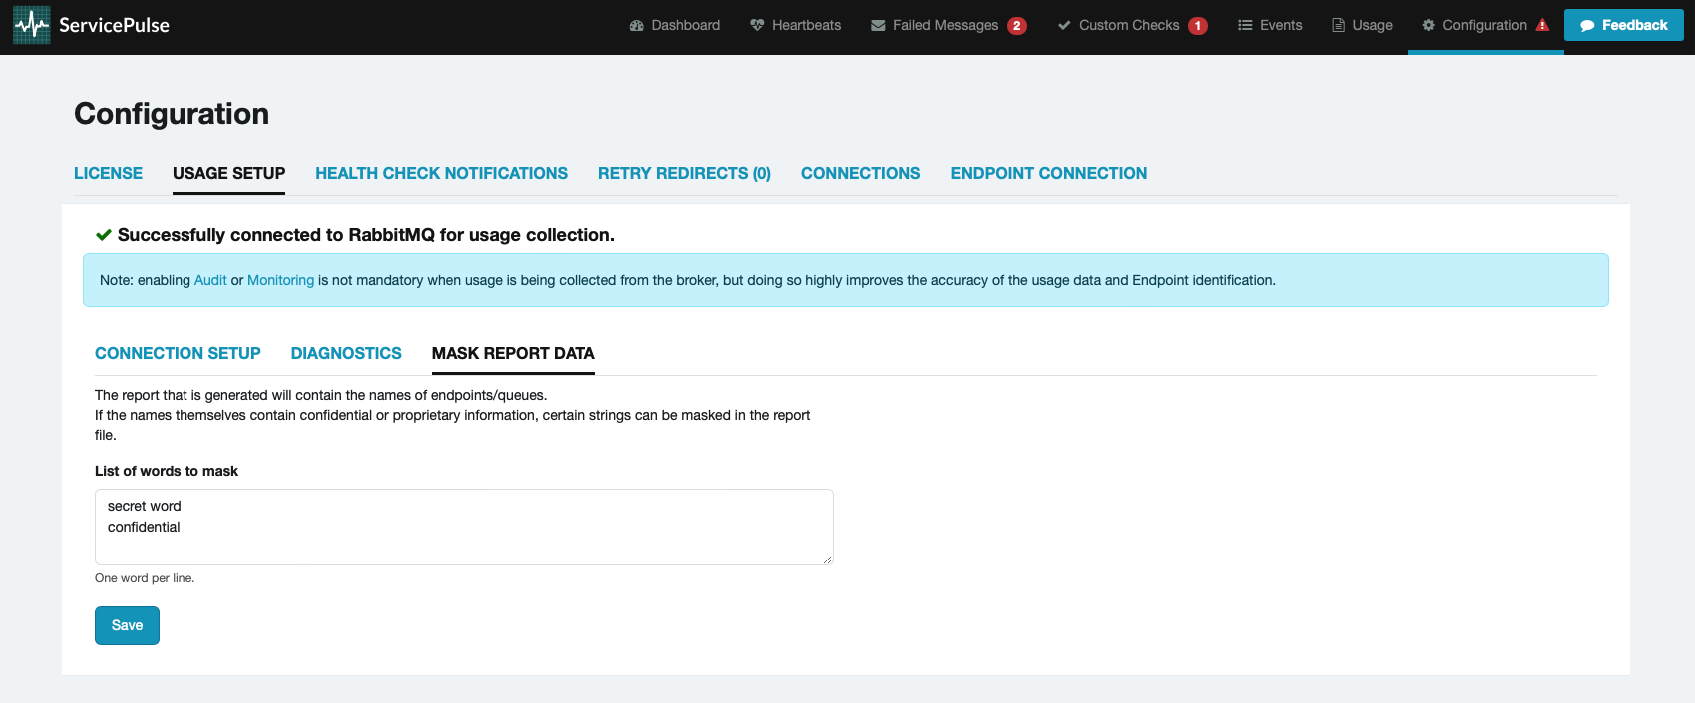
Report masks
Information that is considered sensitive can be obfuscated in the usage report. All words to be redacted can be specified in the Mask Report Data tab. Specify one word per line.


