ServicePulse is a web application designed to provide both administrators and developers with powerful tools for monitoring and managing systems. It offers a clear, near real-time, high-level overview of system functionality, along with common failure recovery operations such as retrying failed messages. Additionally, it provides a rich, graphical view of detailed performance metrics, including insights into logical endpoints, physical instances, and individual message types.
For administrators, ServicePulse simplifies system oversight and is essential for generating usage reports to determine licensing requirements. For developers, it offers advanced debugging capabilities; including visualizations of message flows, saga state changes, and other system behaviors. Tools like message flow diagrams and sequence diagrams make it easy to detect anomalies and incorrect behavior. Developers can also access detailed information, such as message headers and metadata, when viewing individual messages.
Pre-requisites
ServicePulse uses information provided by ServiceControl. To use ServicePulse, first set up ServiceControl.
- For failed message viewing and retries, only the base error instance is required.
- For message flow visualisation and viewing successful messages, one or more audit instances are required.
- For monitoring throughput and other metrics, a monitoring instance is required.
ServiceControl version 6.13 and above include integrated ServicePulse.
Relationship between ServicePulse, ServiceControl, Monitoring, and Endpoints
ServicePulse views
ServicePulse provides a variety of views to help monitor and manage the health of an NServiceBus system. These views offer insights into system status, endpoint health, real-time metrics, and message processing. Each view is designed to give users actionable information to ensure smooth operation and quick resolution of issues. The following views are available in ServicePulse,
See the video below to get an overview of the views available in ServicePulse.
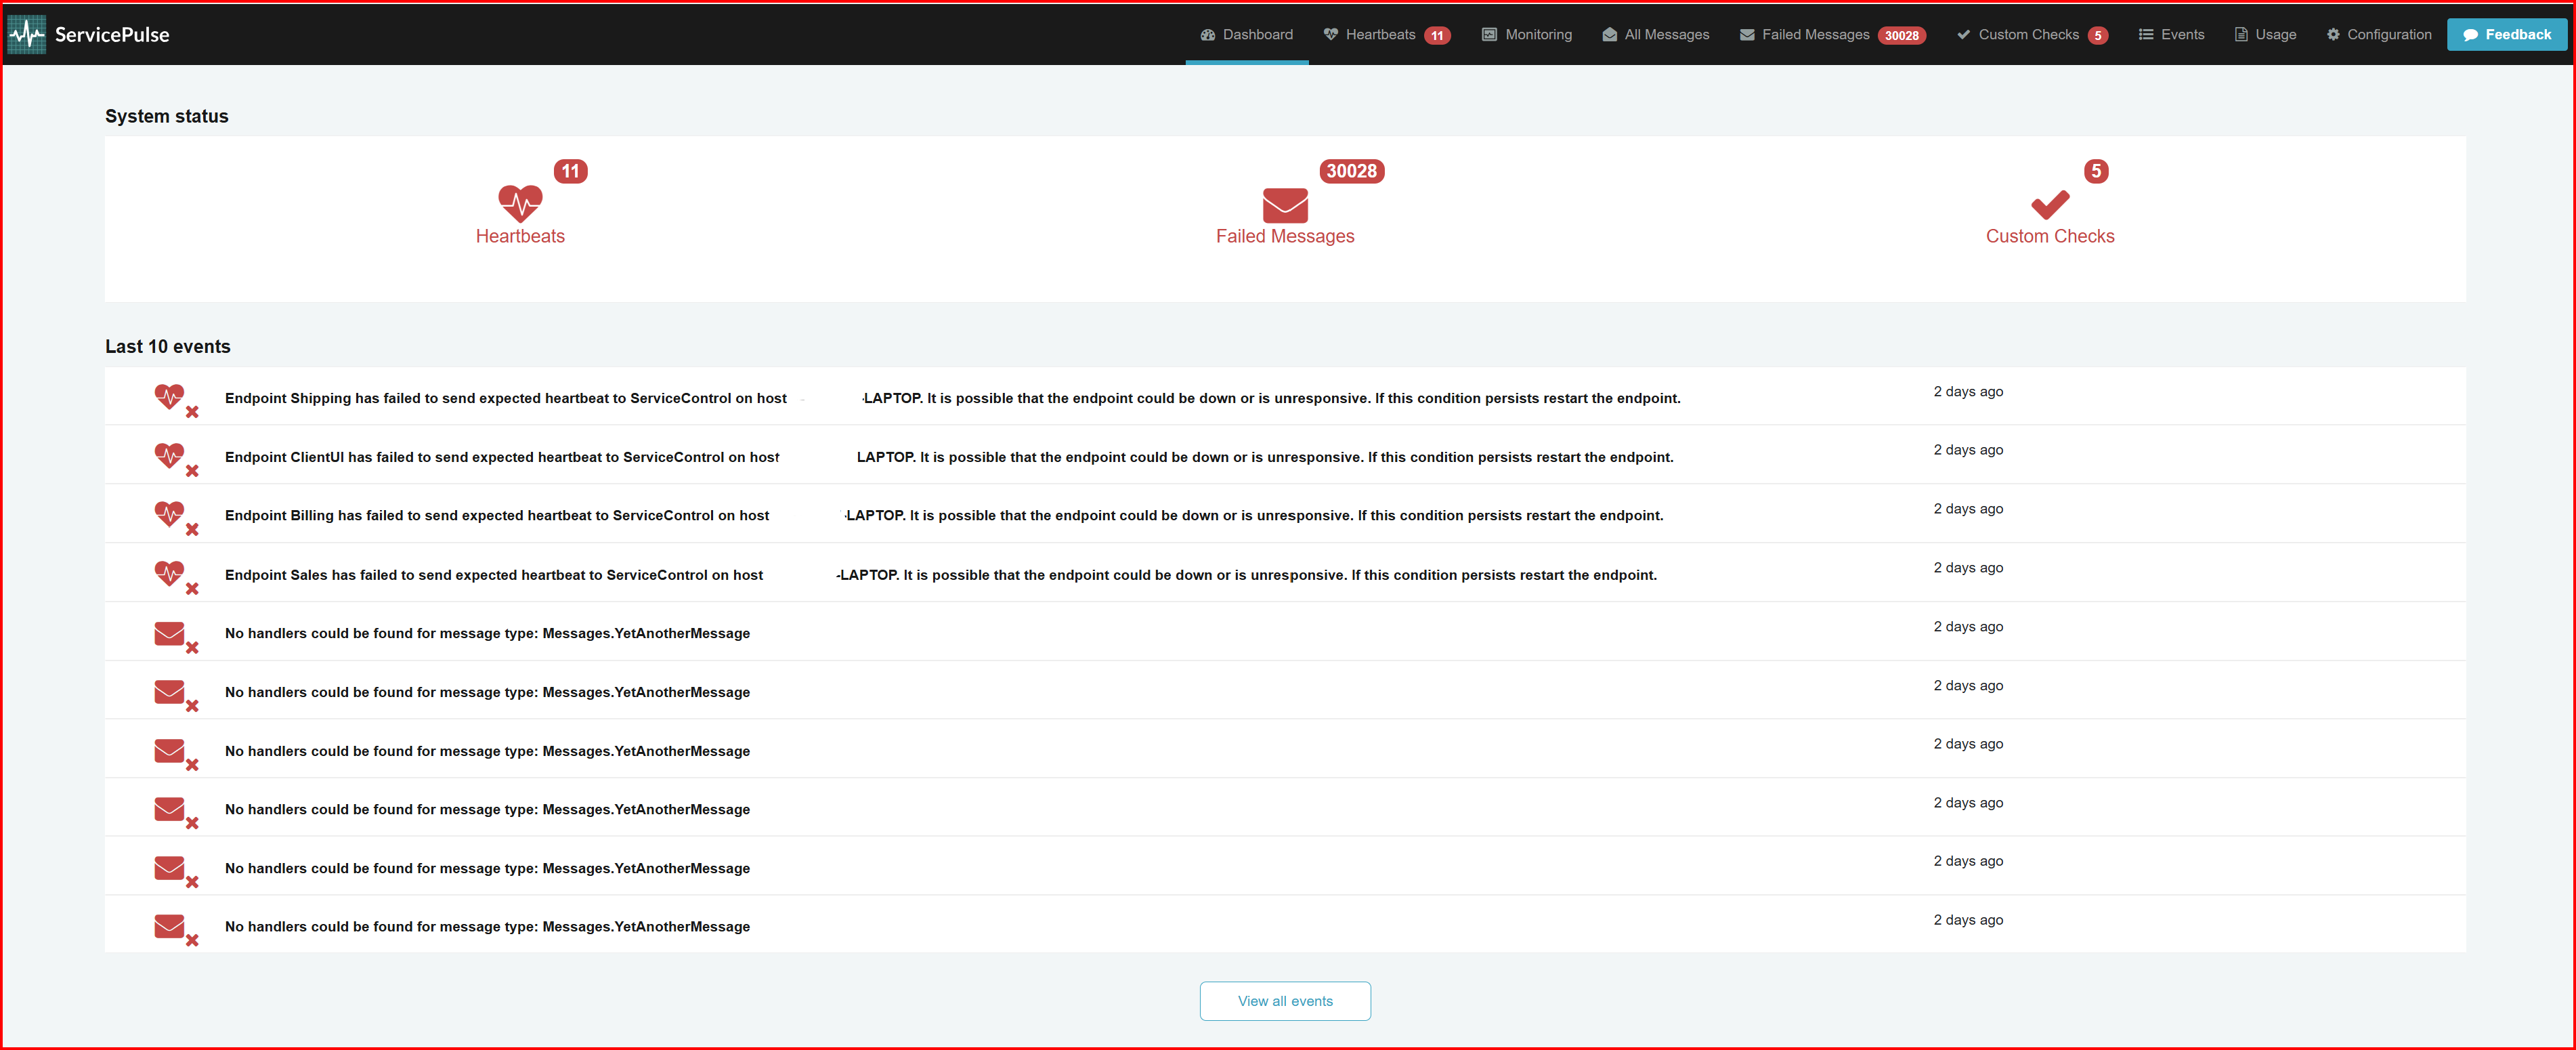
Dashboard
The dashboard provides a visual overview of the current state of the monitored NServiceBus system. This includes unhealthy endpoints, failed messages and failing custom checks. It also provides information about the latest events in the system, such as detecting a new endpoint or a message processing failure.
Learn more:
Heartbeats
ServicePulse automatically detects existing endpoints' health in the system by analyzing metadata from audited messages. By default, all detected endpoints will be listed but will not be automatically monitored.
In order to monitor an endpoint's health and activity, it is necessary to configure it for monitoring.
Learn more:
Monitoring
The "Monitoring" view provides a real-time overview of all logical endpoints in the system, along with various metrics. To see more details, click on an endpoint name. This opens a view showing the same metrics, broken down by message type or endpoint instance.
Learn more:
All messages
The "All Messages" view displays messages processed by the system within a specified timeframe. If audit instances are not deployed, only failed messages will be shown, and the individual message view will lack detailed flow, sequence, and saga information.
Learn more:
Failed messages
Failed messages are highlighted in the ServicePulse dashboard with a red icon displaying the number of failures.
The Failed Messages tab allows inspection of failed messages in more detail and to react to failures (by manually retrying or deleting messages). The messages are grouped by:
- The exception type
- The exception message
- The endpoint name
- The endpoint instance ID
- The queue address
Learn more:
Custom checks
Endpoint health monitoring verifies that an endpoint is operational—able to receive, process, and send messages. However, in some cases, overall system functionality may depend on external factors, such as third-party web services.
ServicePulse supports the development of custom health checks using custom .NET code. Custom checks allow an endpoint to notify ServicePulse if a business-related condition is not met. If a condition is not met, ServicePulse will raise an alert.
Learn more:
Events
This dedicated events page shows all events captured within ServiceControl.
Learn more: