ServicePulse gives an overview of a system's health, based on endpoints heartbeats and custom checks, and a detailed view of failed messages.
The same information can be consumed not only via the ServicePulse web interface, but also by subscribing to custom notifications and alerts from ServiceControl.
Heartbeats
HeartbeatStopped
The HeartbeatStopped event is published each time the monitoring infrastructure does not receive a heartbeat from an endpoint within the expected amount of time.
HeartbeatRestored
The HeartbeatRestored event is published to notify when a previously stopped heartbeat has been restored and the related endpoint is running as expected.
More details on endpoints and heartbeats in ServicePulse.
MessageFailed
The MessageFailed event is published to notify that a message has failed all the immediate retry steps and all the delayed retry steps and has reached the configured error queue. The event itself carries all the details of the failure and has a MessageStatus enumeration that details the type of failure:
Failed: The message has failed and has arrived for the first time in the error queue;RepeatedFailure: The message has failed multiple times;ArchivedFailure: The message has been deleted;
More details on failed message monitoring in ServicePulse.
Custom check / Periodic check
Custom checks allow an endpoint to notify ServicePulse if a business related condition is not met. The endpoint heartbeat signals that the endpoint is running and that a custom check can add more information, for example, that the endpoint is running and can access the external resources required to operate correctly.
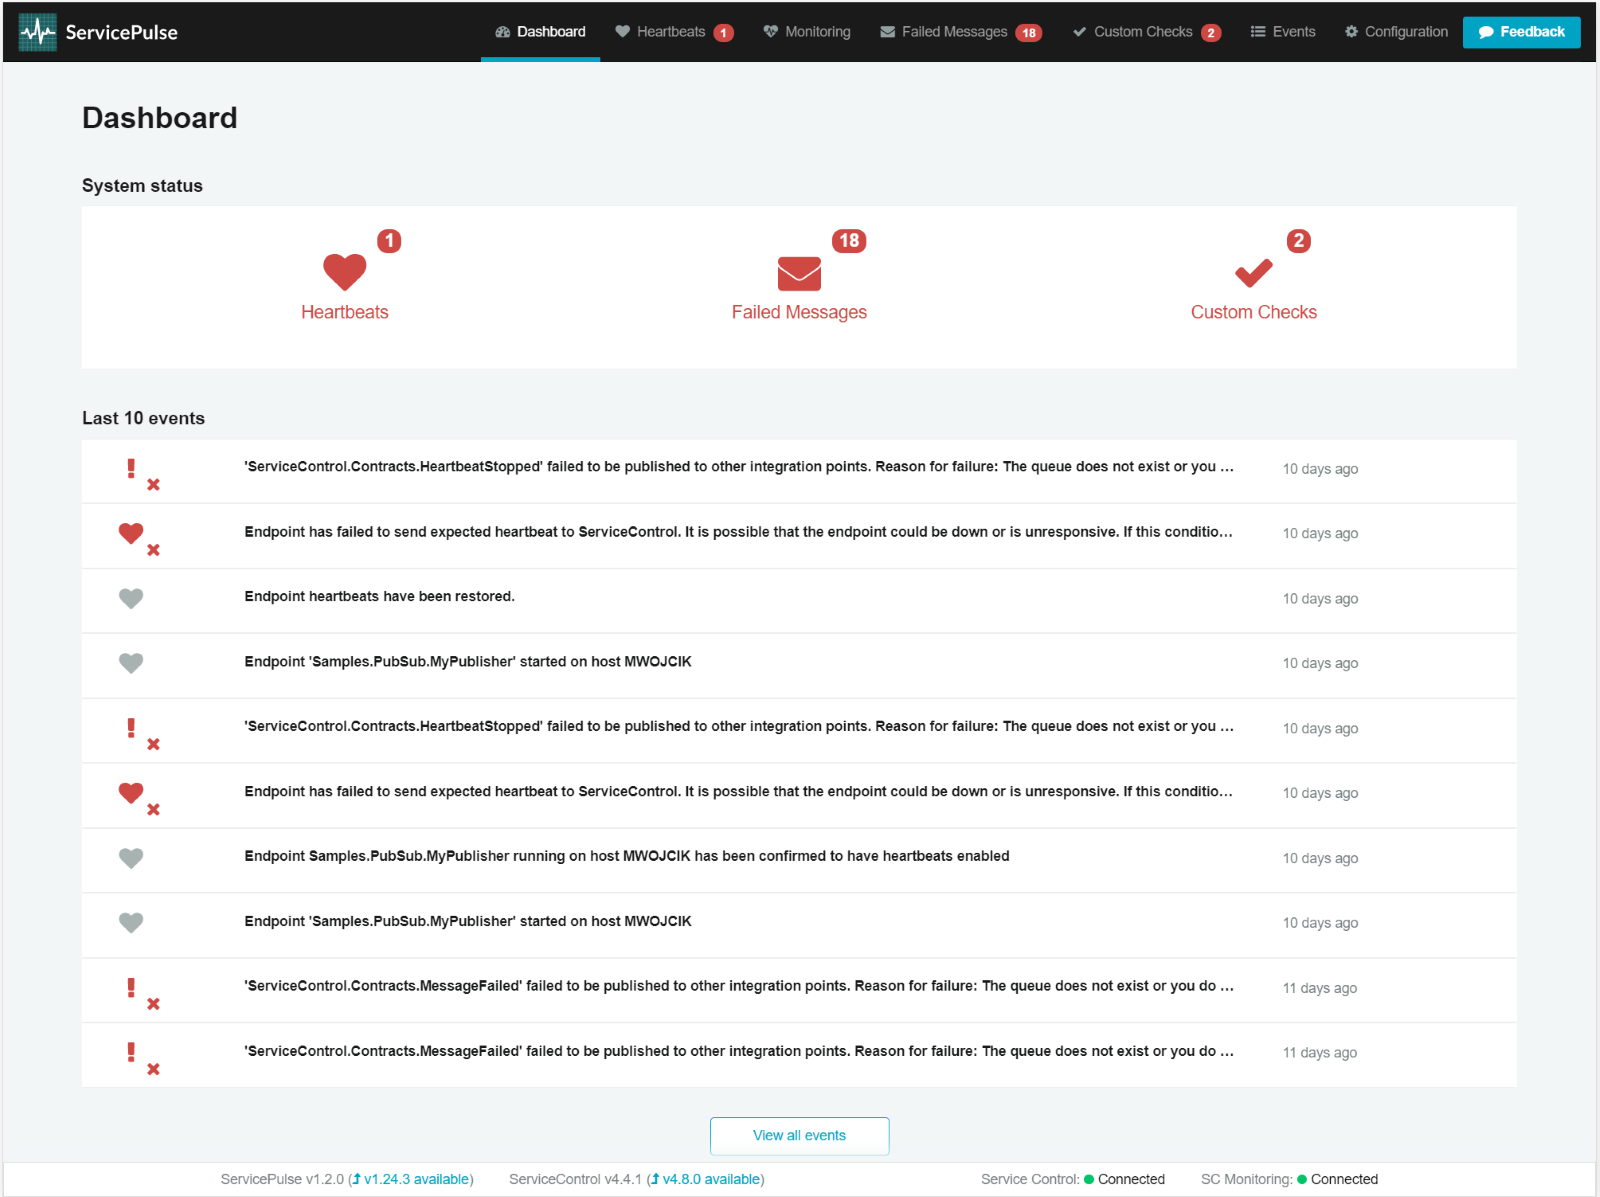
Dashboard screen
The dashboard shows the last 10 events that were reported by ServiceControl.
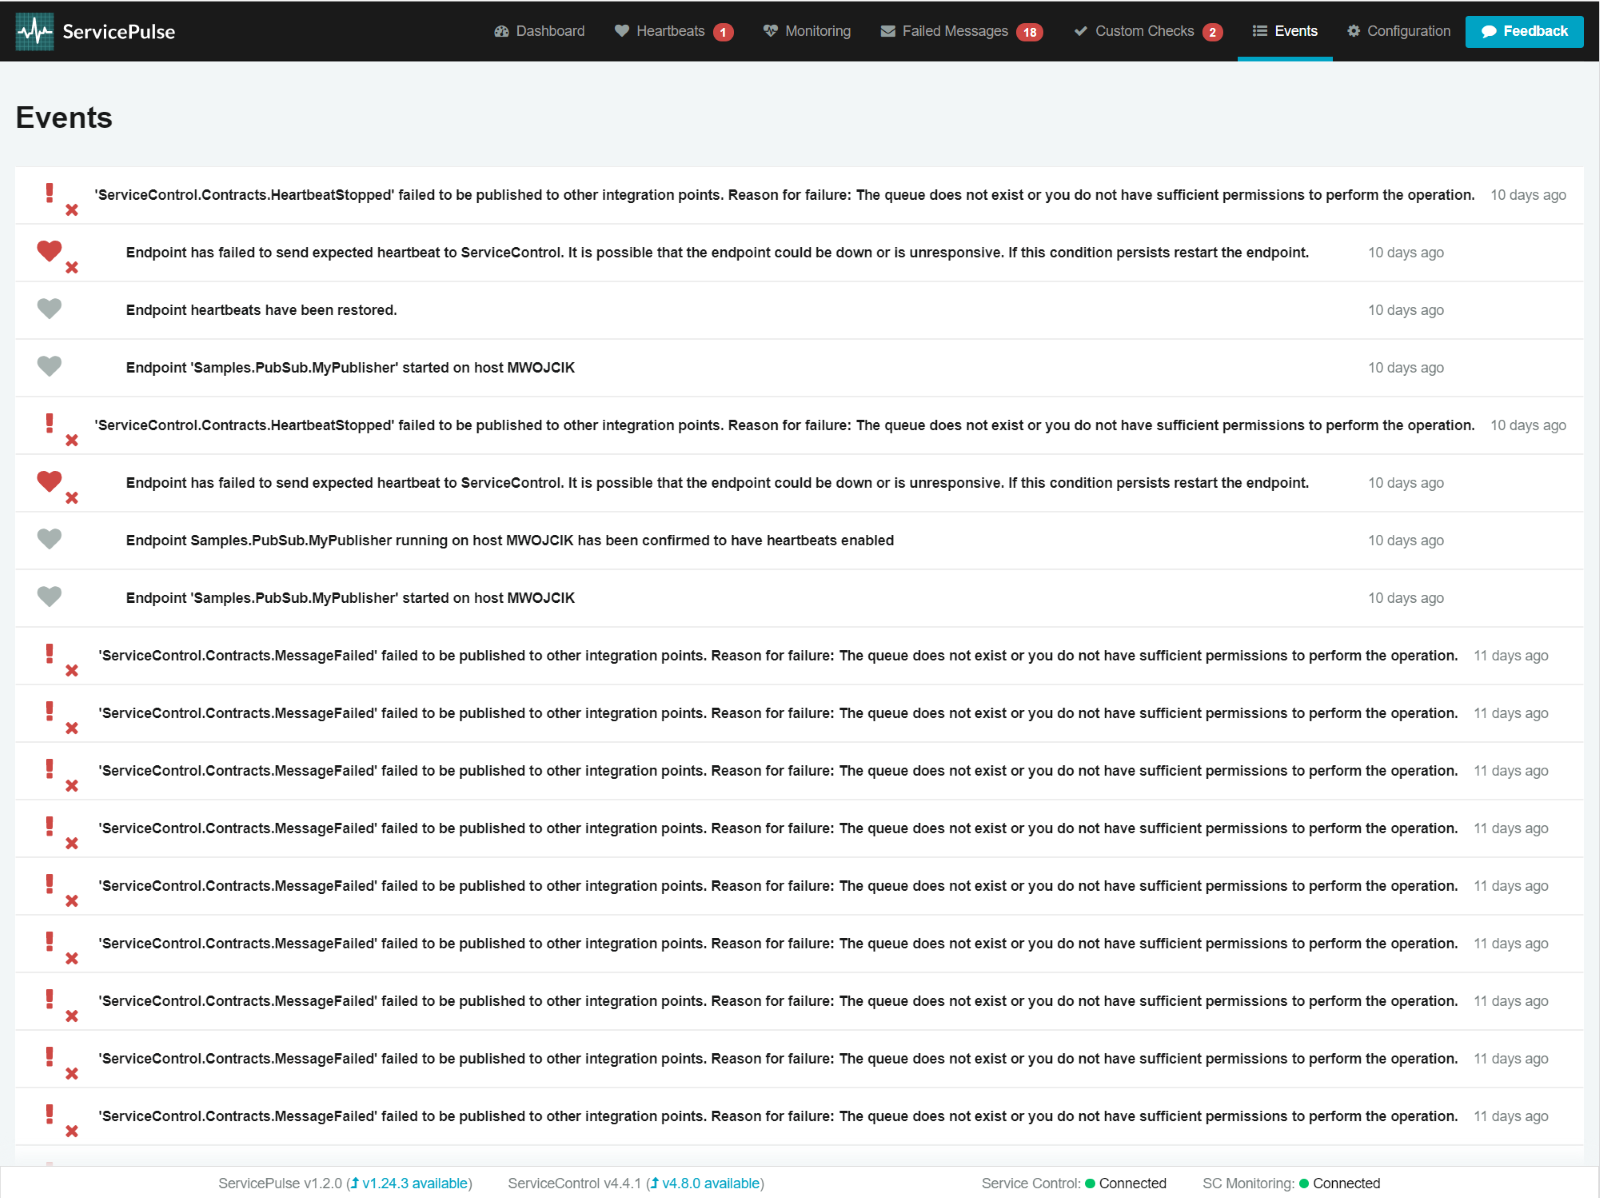
View all events by clicking on the 'Events' link in the menu or the 'View all events' link on the dashboard. These links redirect to the dedicated events page which shows all events captured within ServiceControl.

