The Flow Diagram in ServicePulse visually represents how a message and its related messages flow through the system, across endpoints, and through sagas. It helps users trace message conversations, understand relationships, and diagnose issues in distributed workflows.
Overview
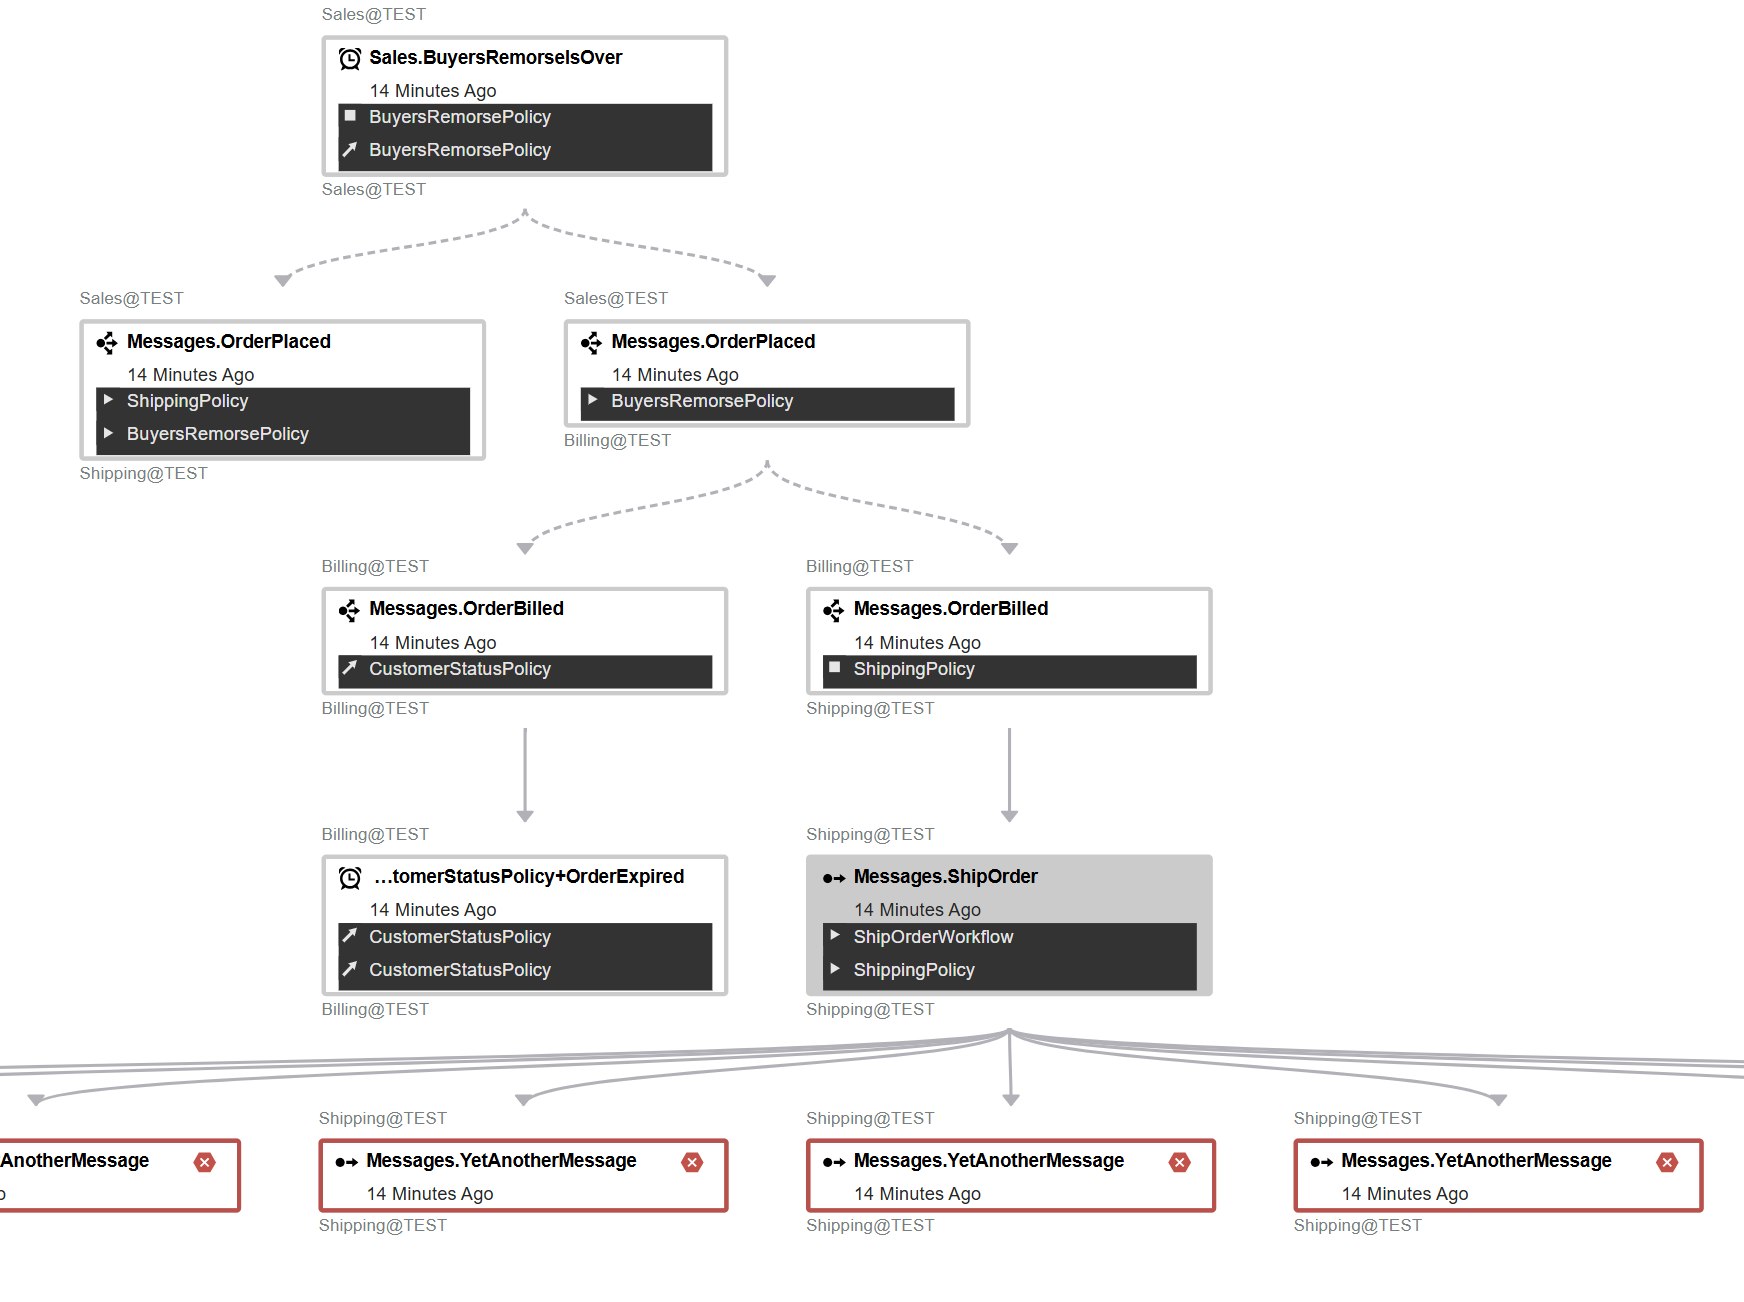
When a message is selected from the message list, the Flow Diagram presents all related messages within the same conversation. Each message appears as a node in a top-down layout, visually connected to other messages that it caused or was caused by. The Flow Diagram displays:
- Messages as nodes (Message types can be a command, event or timeout)
- Relationships between messages as arrows or dotted lines
- Endpoint information
- Saga invocations and their states (Saga initiated/updated, Saga completed or Message originated from saga)
- Message processing status which can be a successful or failed.
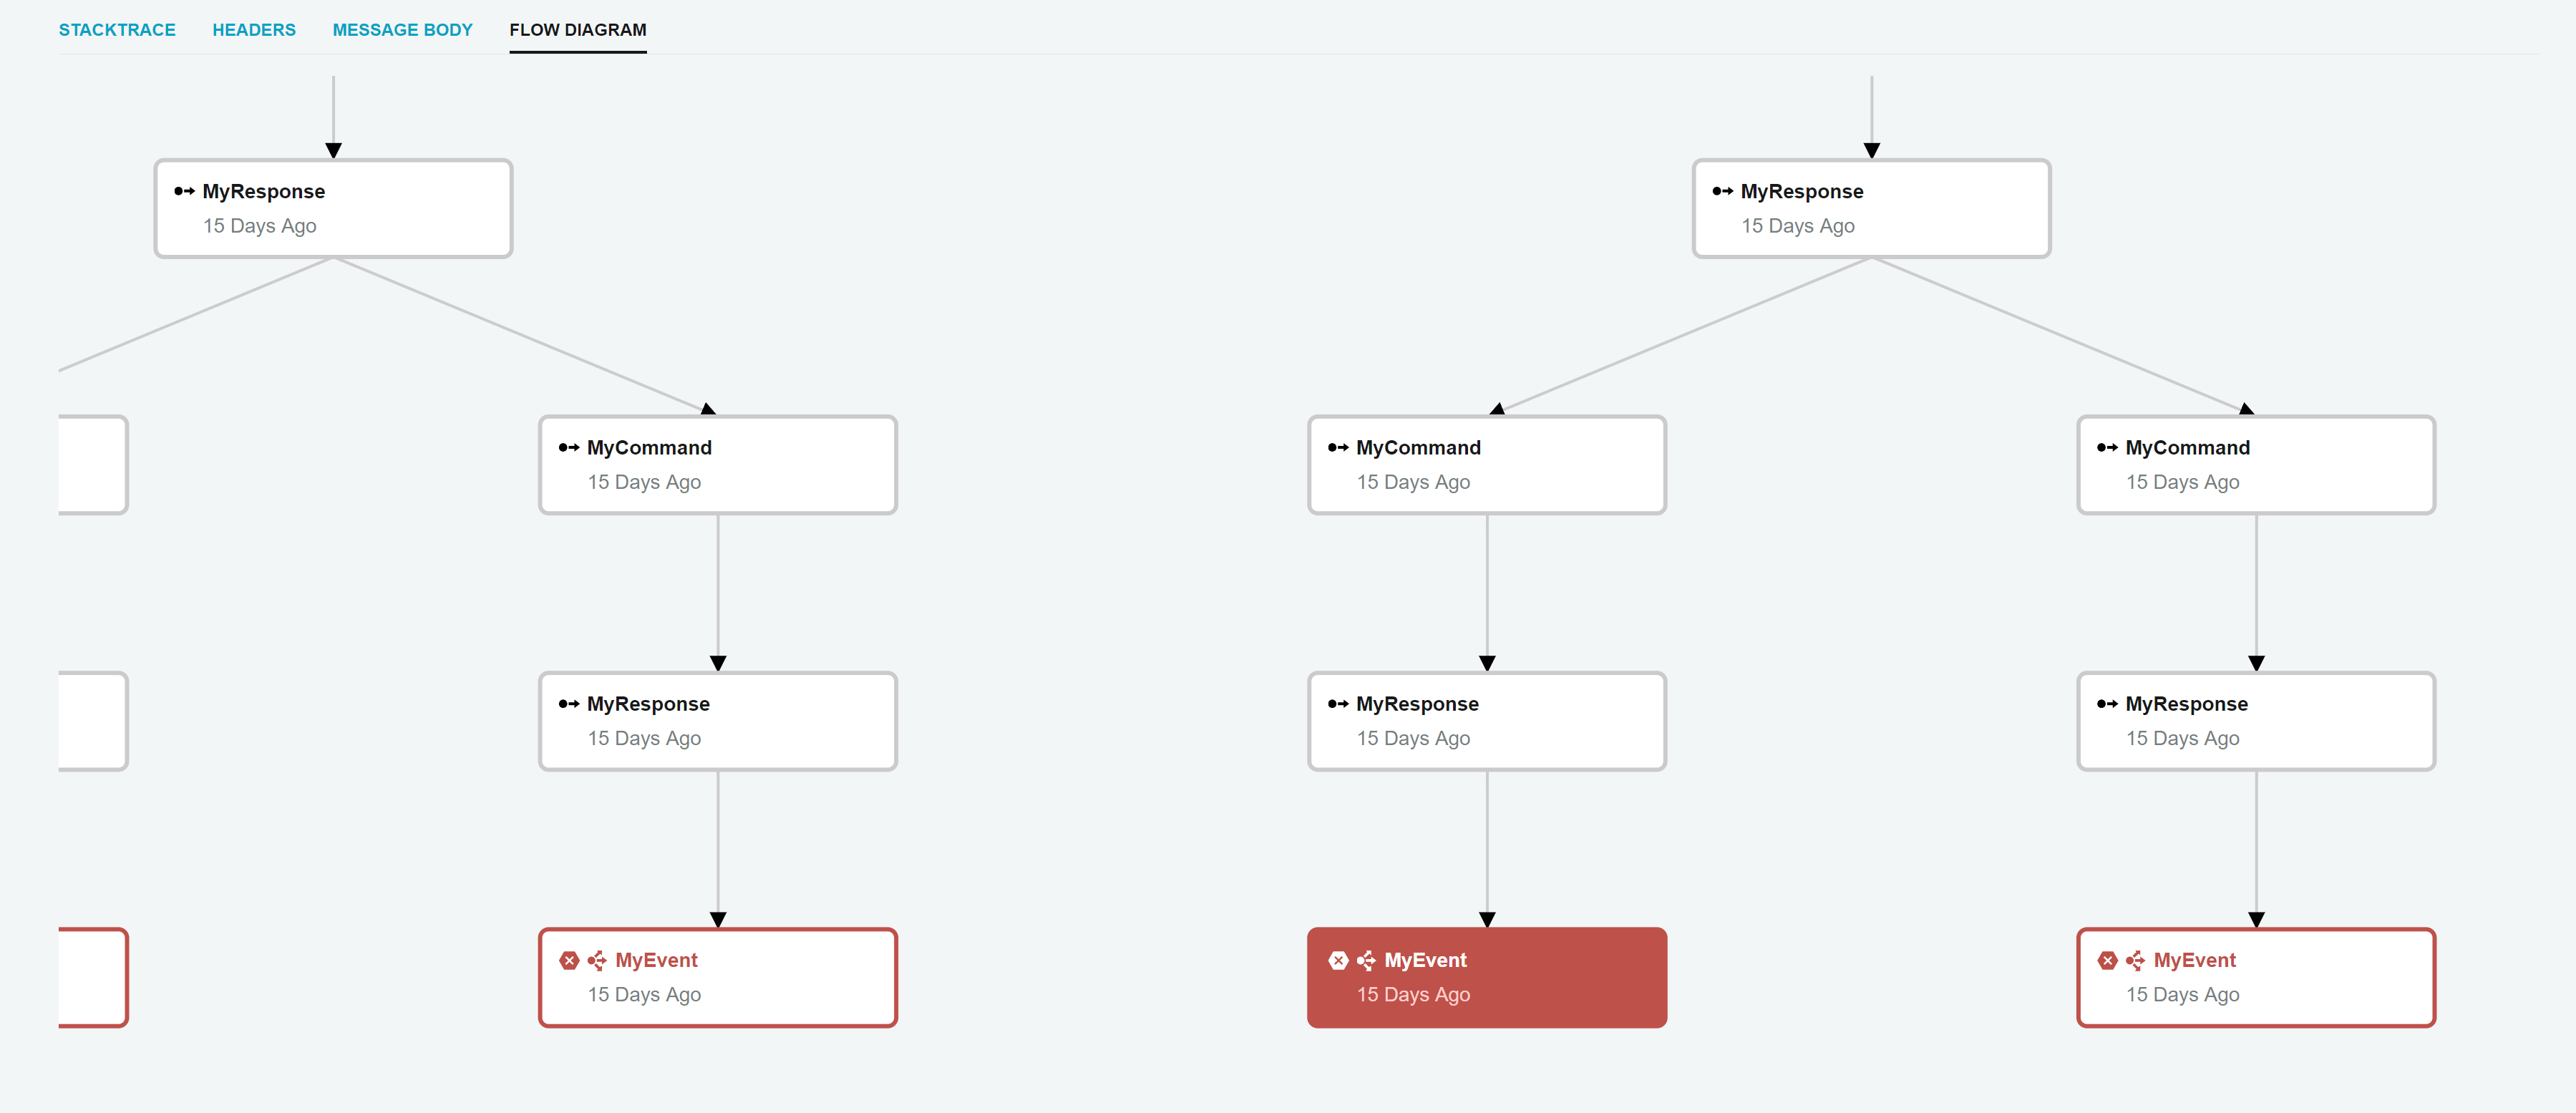
Command messages are represented with solid arrows, indicating a direct relationship between sender and receiver. Events are represented using dashed arrows to reflect their publish-subscribe nature. This visualization is particularly useful for troubleshooting issues or understanding the complete lifecycle of a message, including how it interacts with sagas or leads to other message activity. Zooming and panning are supported and users can interact with the diagram to explore message behavior and diagnose issues.
Node Information
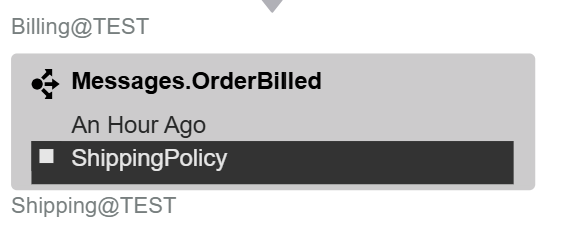
Each node in the flow diagram represents a message. The message node includes an icon and background color to reflect its status. Failed messages appear with a red border and a selected failed message appears with a red background. A selected processed message appears with a gray background.
Nodes contain the following details:
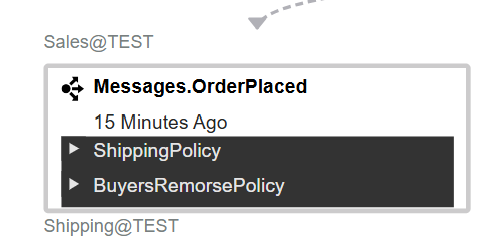
- The sending endpoint at the top (with host name)
- Message type with a specific icon
- The receiving endpoint at the bottom (with host name)
- Message processing time
- Saga interaction indicators (when applicable)
| Node Image | Description |
|---|---|
 | Command Message |
 | Event Message |
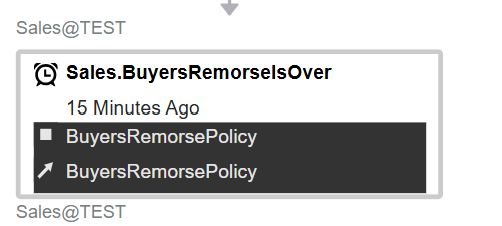 | Timeout Message |
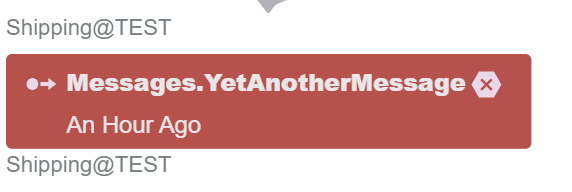 | Selected Failed Message |
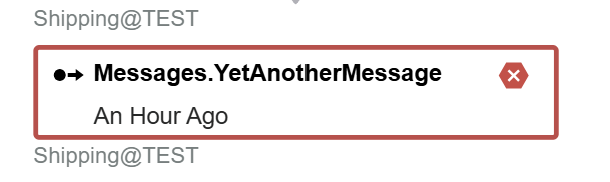 | Failed Message |
 | Selected Message |
Saga Indicators
A message that starts a saga displays a "Saga Initiated" icon. If a message updates an ongoing saga's state then this is also indicated. When a saga concludes, the associated message is marked to show "Saga Completed". These visual cues assist with following the lifecycle of long-running business processes across multiple messages.
| Saga Icon | Description |
|---|---|
| Message Originated From Saga | |
| Saga initiated/Updated | |
| Saga Completed |