Overview
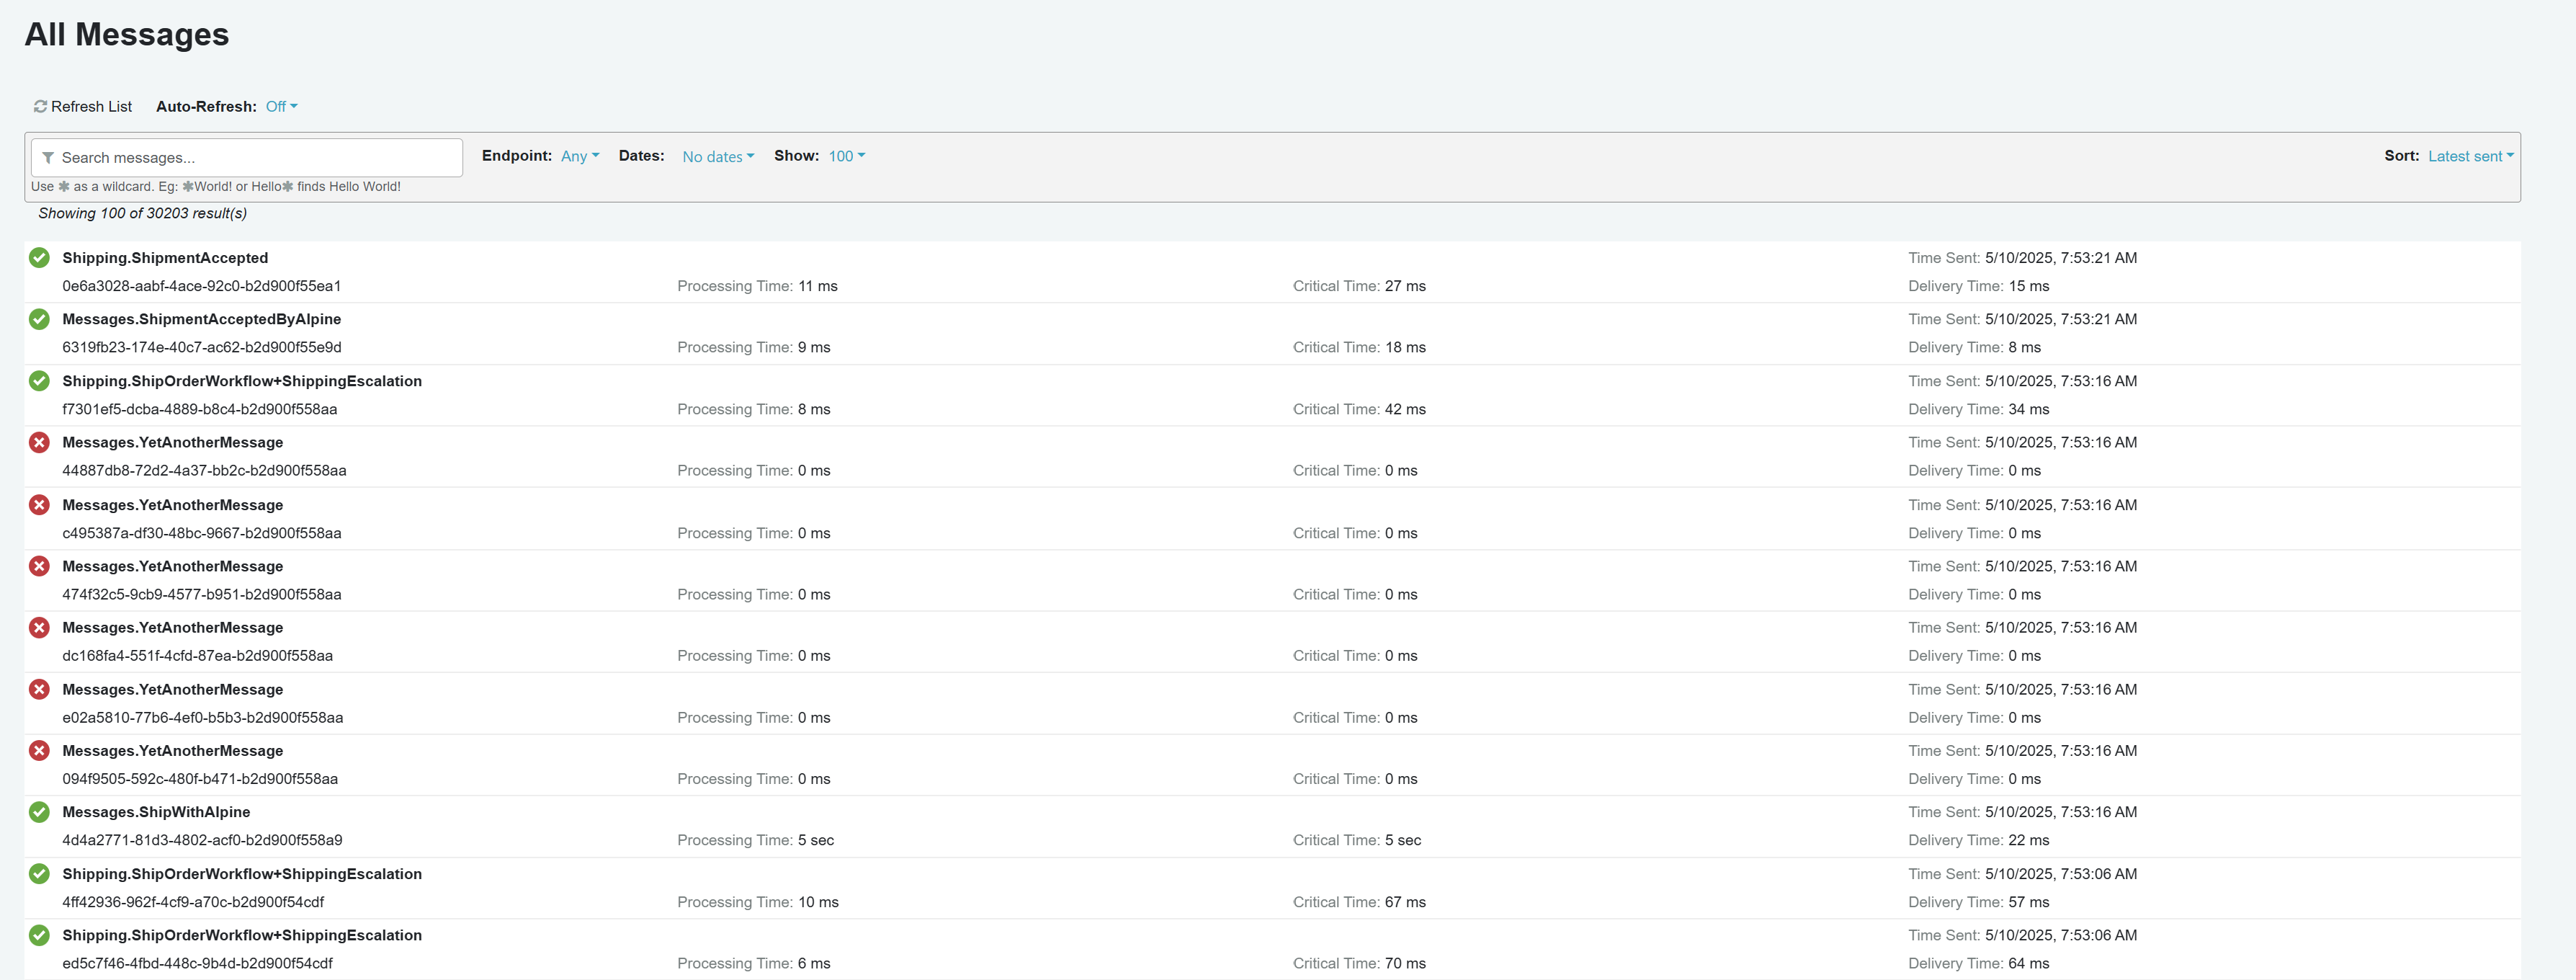
ServicePulse provides visibility into the flow of messages through the system, including both audited and failed messages. It displays the message status, message type, message ID, processing time, critical time, time sent, and time delivered in a comprehensive list view. Clicking any message navigates to a detailed view of that message.
Message Information

Each row in the list represents a message in the system. Each message is prefixed with a status icon that shows the nature of the message.
| Status Icon | Description |
|---|---|
| Shows when a message was processed successfully on the first attempt | |
| Shows when a message succeeded after retries | |
| Shows when a message has failed | |
| Shows when a failed message has been deleted | |
| Shows when a message has failed multiple times | |
| Shows when a retry has been requested for a failed message |
A warning symbol ![]() also appears when any of these conditions are met:
also appears when any of these conditions are met:
- When a message needed retries to succeed
- When any of the timing metrics (critical, processing, or delivery time) have negative values, which could indicate timing issues or clock synchronization problems
The following time-related information about the message is also displayed:
- Processing Time: The time taken by the receiving endpoint to successfully process an incoming message.
- Critical Time: The total duration from when a message is sent to when it is fully processed.
- Time Sent: The timestamp when the message was originally sent from the sending endpoint.
- Delivery Time: The time taken to deliver the message from sender to receiver before processing begins.
Filtering
The results can be filtered by one or more of the following criteria:
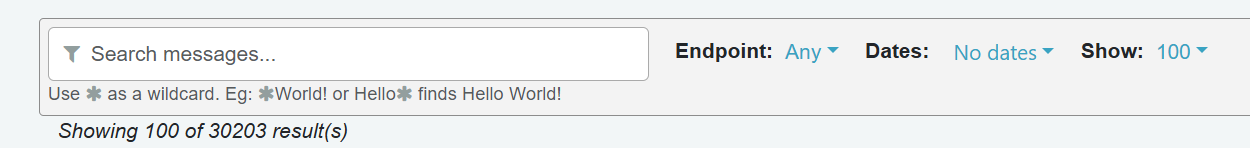
- Date Range: Specify the date range along with the time within that range.
- Endpoint: Select a specific endpoint.
- Custom Filter: Perform a free-text search across message data.
By default, the view displays 100 messages but can be customized to display up to a maximum of 500 messages. To display specific messages, modify the filters to narrow down the displayed results.
Filtering Options
The search filter works in the following way:
- The filter is case insensitive (i.e.,
termandTERMwill return the same results). - A message will be returned if it matches at least one of the terms (i.e., the logical operator between the terms is
OR). - A
*wildcard can be used to replace a prefix and/or a postfix of a searched term (i.e.,wordwill be found by*rd,wo*, and*or*). - Other logical operators (e.g., conjunction, negation) are not supported.
A message's body is searchable only if the body size is under 85kB, within the ServiceControl. size limit, and is a non-binary content type.
Sorting Options
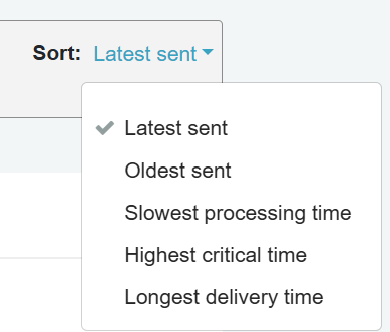
Messages can be sorted by any of the following criteria:
- Latest Sent
- Oldest Sent
- Slowest Processing Time
- Highest Critical Time
- Longest Delivery Time
Refresh Messages
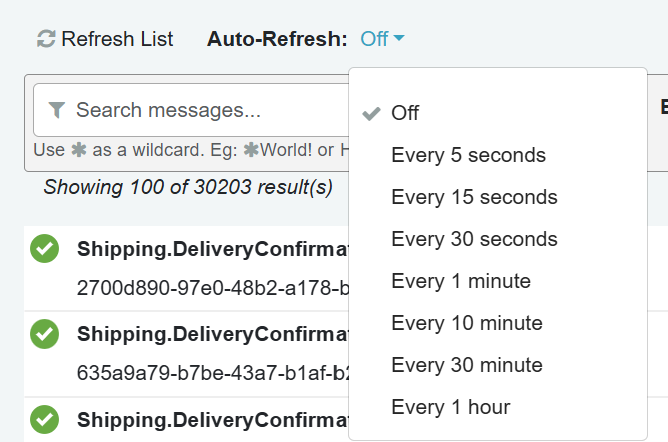
The view supports both manual and automatic refresh. These options update the displayed information with the latest updates from the ServiceControl database.
- Manual Refresh: Click the "Refresh List" button to manually refresh the list.
- Auto-Refresh: Automatically refreshes the list at configurable intervals, delivering near real-time information. The available intervals are:
- Every 5 seconds
- Every 15 seconds
- Every 30 seconds
- Every 1 minute
- Every 10 minutes
- Every 30 minutes
- Every 1 hour
Having a low auto-refresh time, continually active,e can have a negative impact on ServiceControl's performance