Azure Application Insights (App Insights) provides monitoring and alerting capabilities that can be leveraged to monitor the health of NServiceBus endpoints.
This sample shows how to capture NServiceBus OpenTelemetry traces and export them to App Insights. The sample simulates message load as well as a 10% failure rate on processing messages.
Prerequisites
This sample requires an App Insights connection string.
Although the sample uses Azure Application Insights, the solution itself does not require an Azure message transport. This example uses the Learning Transport but could be modified to run on any transport.
Running the sample
- Create an Application Insights resource in Azure
- Copy the connection string from the Azure portal dashboard into the sample
- Start the sample endpoint
- Press any key to send a message, or ESC to quit
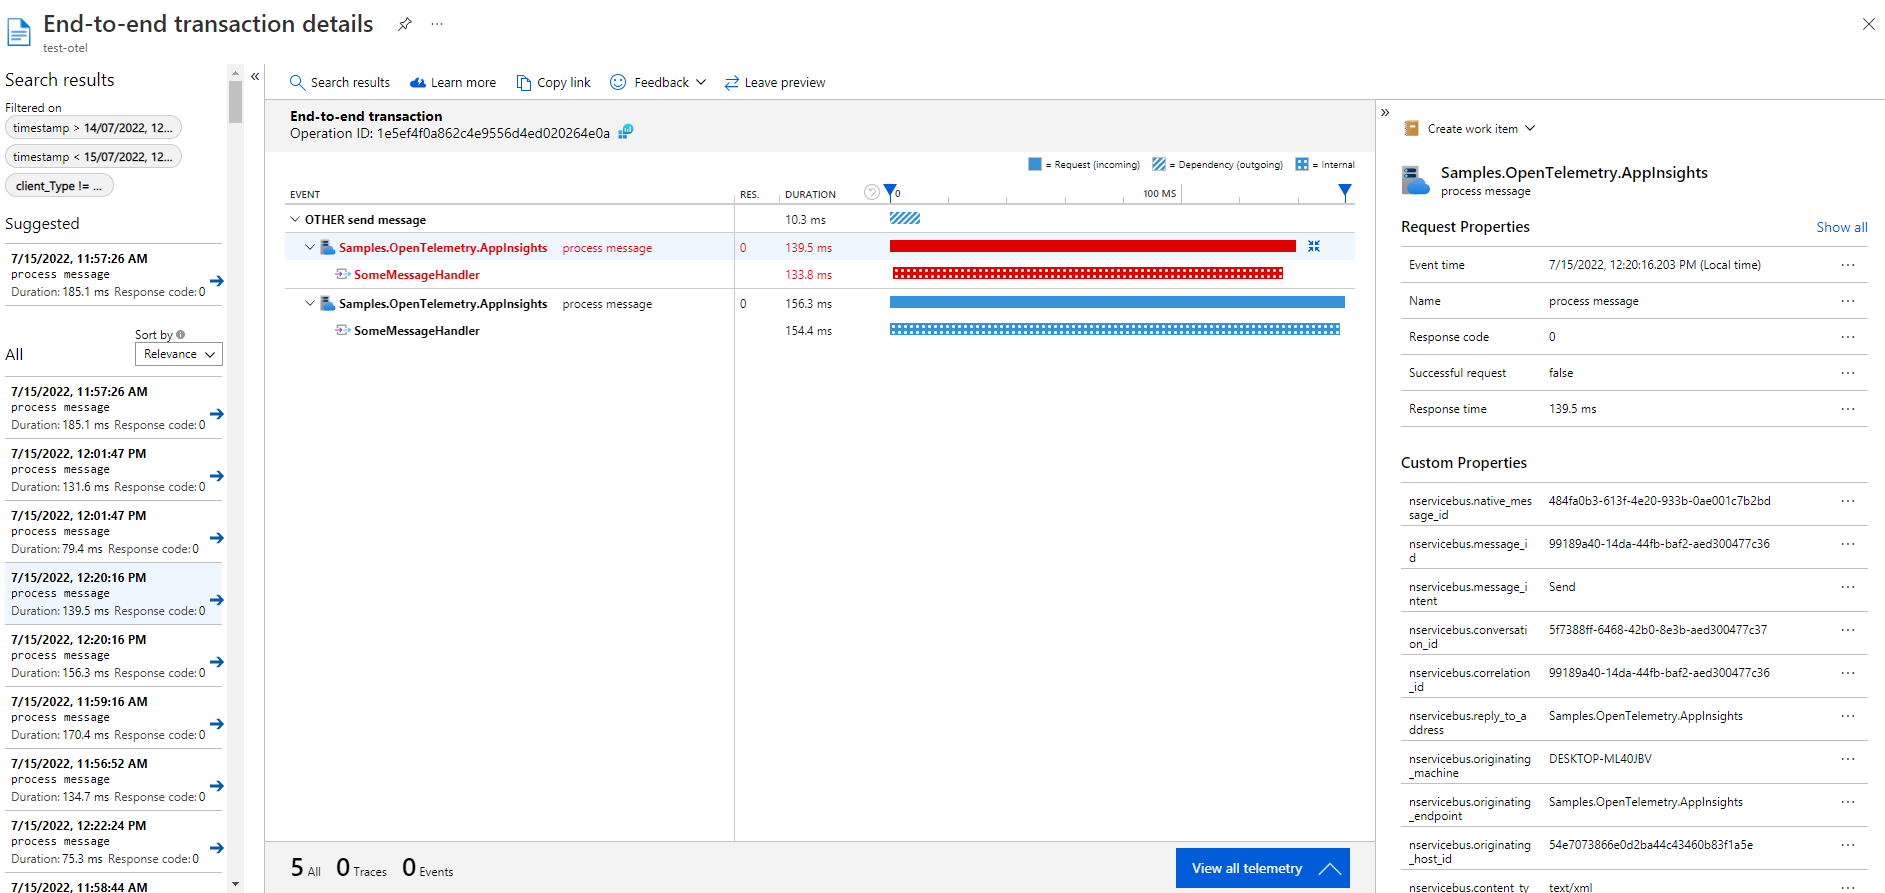
Reviewing traces
- On the Azure portal dashboard, open the Investigate → Performance panel
- Drill into the samples
- Review the custom properties
Reviewing meters
Navigate to Monitoring → Metrics on the Azure portal dashboard for the configured Application Insight instance to start creating graphs.
It may take a few minutes for the meter data to populate to Azure. Meters will only appear on the dashboard once they have reported at least one value.
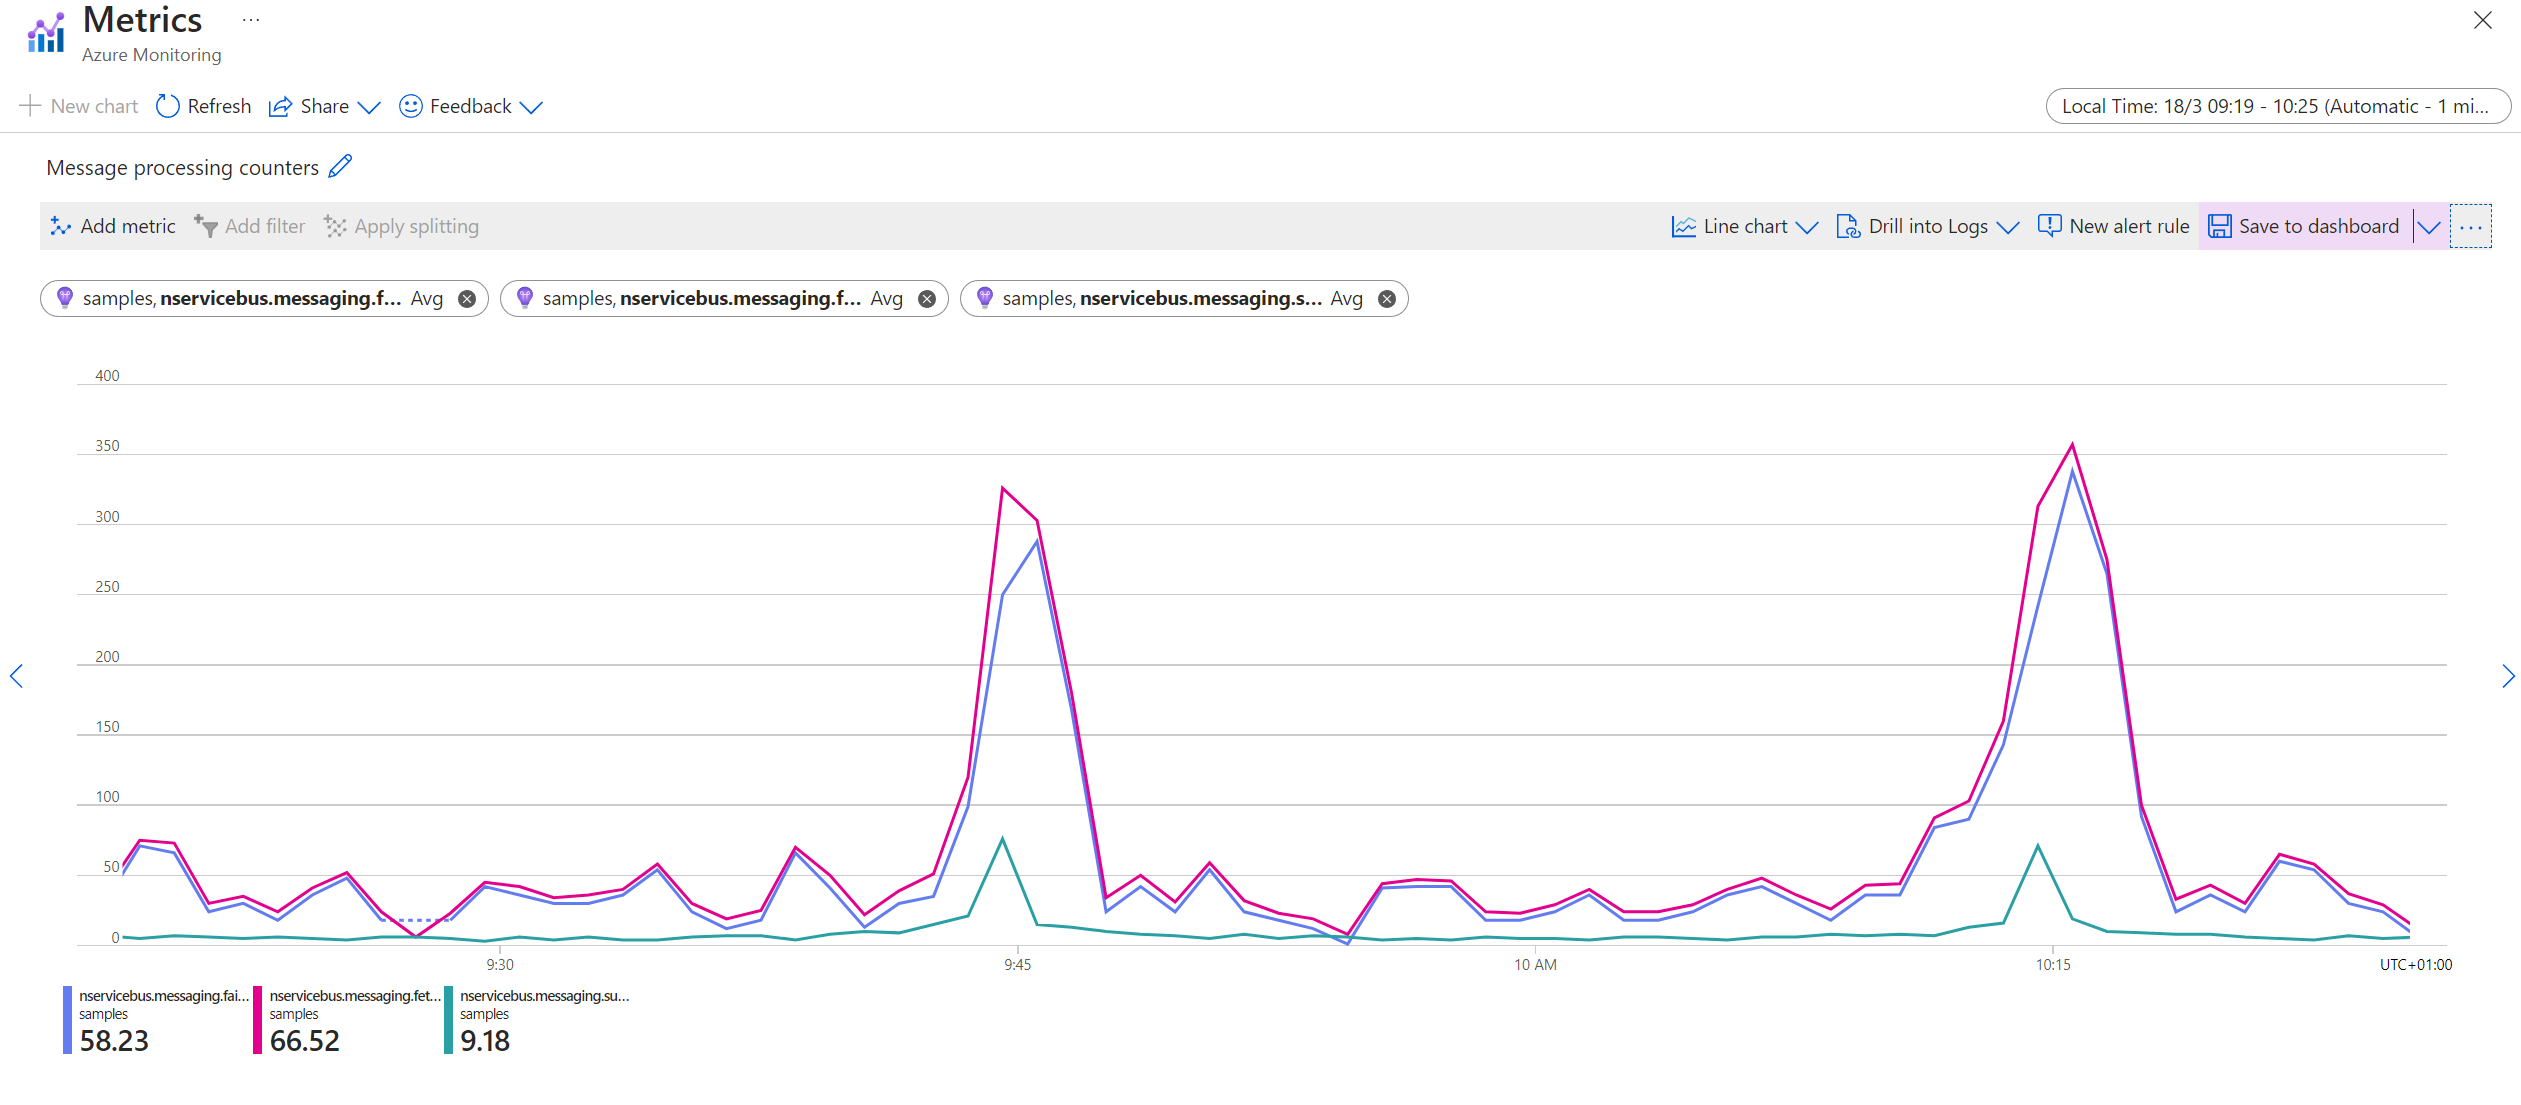
Message processing counters
To monitor the rate of messages being fetched from the queuing system, processed successfully, retried, and failed for the endpoint use:
nservicebus.messaging. fetches nservicebus.messaging. successes nservicebus.messaging. failures
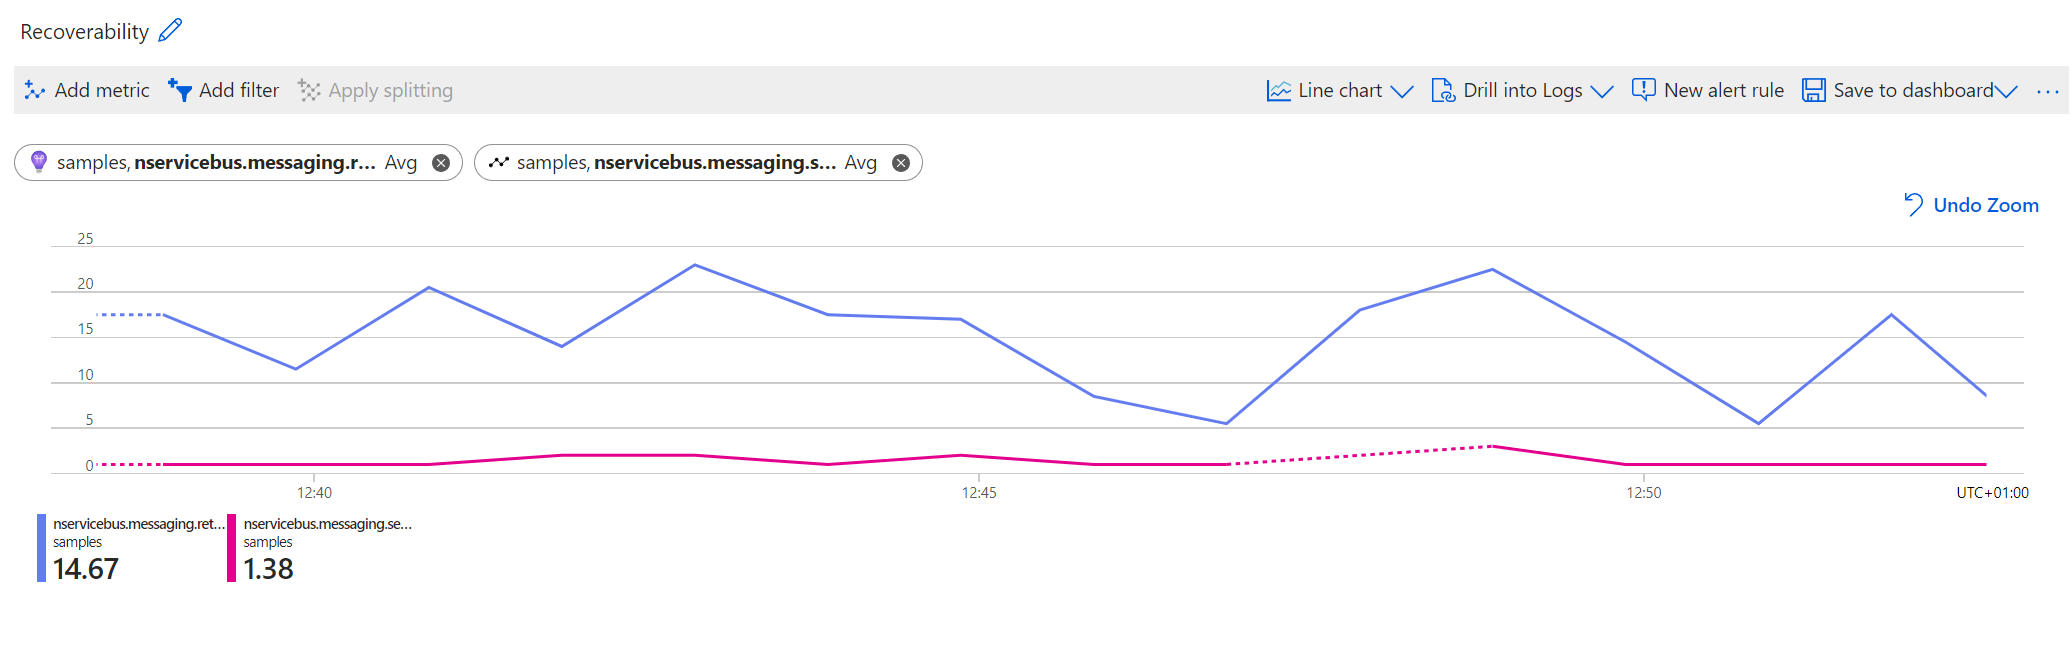
Recoverability
To monitor recoverability metrics use:
nservicebus.recoverability. immediate nservicebus.recoverability. delayed nservicebus.recoverability. error
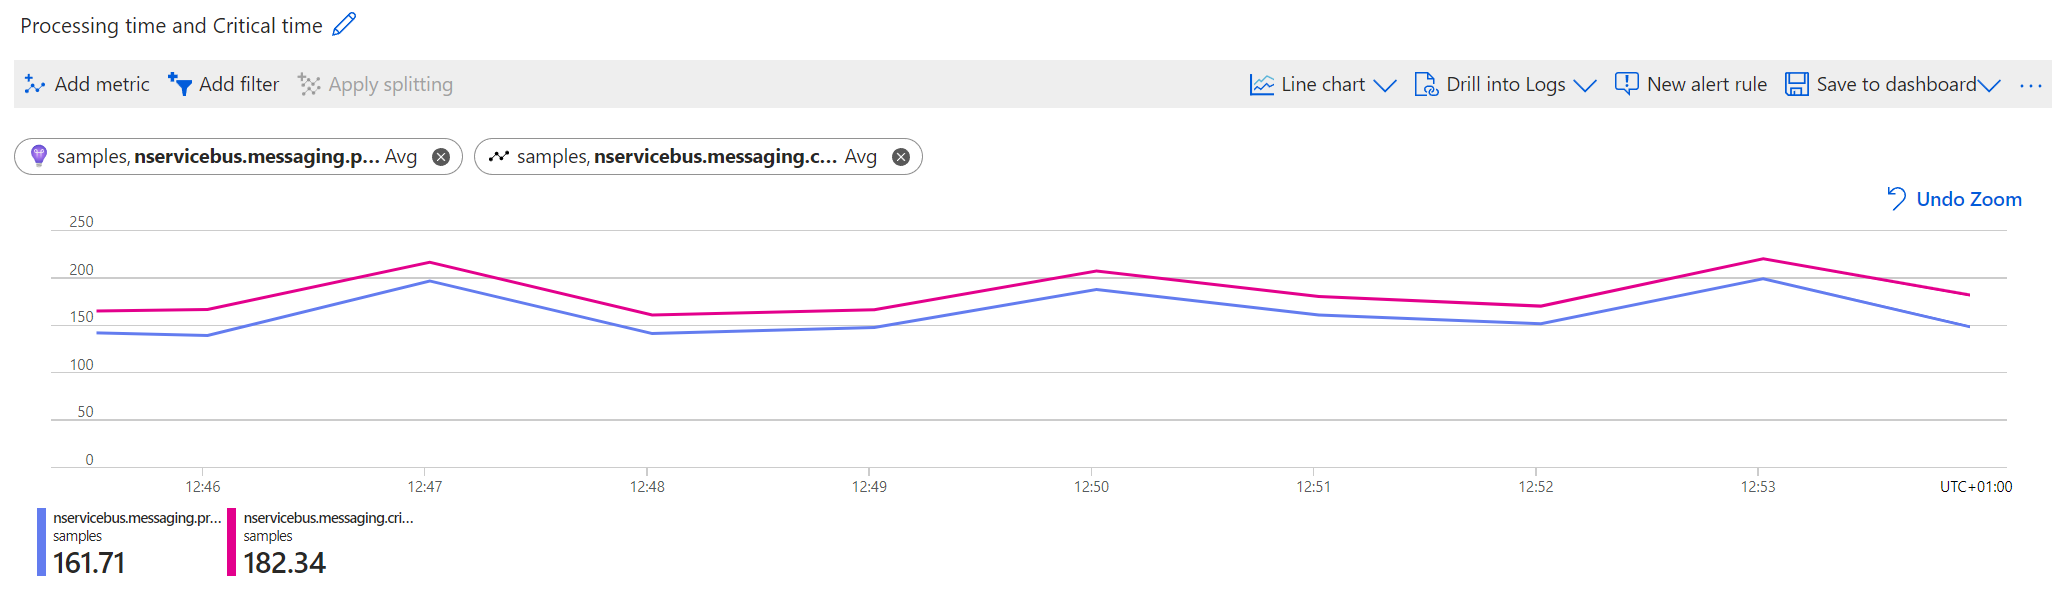
Handler time, critical time, and processing time
To monitor handler time, processing time, and critical time (in seconds) for successfully processed messages use:
nservicebus.messaging. handler_time nservicebus.messaging. processing_time nservicebus.messaging. critical_time
Code walk-through
In versions of NServiceBus lower than 10.0, OpenTelemetry has to be manually enabled:
var endpointConfiguration = new EndpointConfiguration(endpointName);
endpointConfiguration.EnableOpenTelemetry();
Tracing
The endpoint configures an OpenTelemetry trace provider that includes the NServiceBus. source and exports collected traces to Azure Monitor.
var traceProvider = Sdk.CreateTracerProviderBuilder()
    .SetResourceBuilder(resourceBuilder)
    .AddSource("NServiceBus.Core")
    .AddAzureMonitorTraceExporter(o => o.ConnectionString = appInsightsConnectionString)
    .AddConsoleExporter()
    .Build();
Meters
The endpoint configures an OpenTelemetry meter provider that includes the NServiceBus. meter and exports metric data to Azure Monitor.
var meterProvider = Sdk.CreateMeterProviderBuilder()
    .SetResourceBuilder(resourceBuilder)
    .AddMeter("NServiceBus.Core")
    .AddAzureMonitorMetricExporter(o => o.ConnectionString = appInsightsConnectionString)
    .AddConsoleExporter()
    .Build();