ServiceInsight has been sunset and will be deprecated on February 10th, 2027.
No further updates will be made and support will end after the deprecation date.
We recommend migrating to ServicePulse before the deprecation date for vizualization and debugging capabilities.
ServiceInsight is a desktop application designed for developers. It provides advanced debugging, visualizations of messages flowing through the system, saga state changes, and more.
It's quicker and easier to spot anomalies and incorrect behavior in a system using message flow diagrams, sequence diagrams, and other visualizations provided by ServiceInsight. More detailed information, such as message headers and message metadata, is also shown.
Visualizing the system
The ServiceInsight user interface provides multiple views of a distributed system. Using information collected in ServiceControl, ServiceInsight enumerates the endpoints and provides detailed message and relationship data, with formatted views of XML, JSON, and binary messages.
The flow diagram provides a detailed visual overview of the messages, collated by conversation. This view shows the flow in the system, which endpoints raised specific events, and sent or handled messages. The Saga view illustrates the start of a saga, the timeouts, and interactions. The sequence diagram shows the order in which messages have been sent and handled by endpoints in the system.
As endpoints are selected, the other views within ServiceInsight respond and filter the information to show only messages pertaining to the selected endpoint.
Endpoint lists, message information, and message flows will not be populated until messages have been successfully processed by ServiceControl.
Relationship between ServiceInsight, ServiceControl, and Endpoints
In versions of ServiceControl prior to version 4.13.0, saga state change (SagaAudit) information can only be processed via the ServiceControl Queue (the input queue of the main ServiceControl instance). Starting with version 4.13.0, the SagaAudit data can also be processed by the ServiceControl audit instance via the audit queue. The latter approach is recommended.
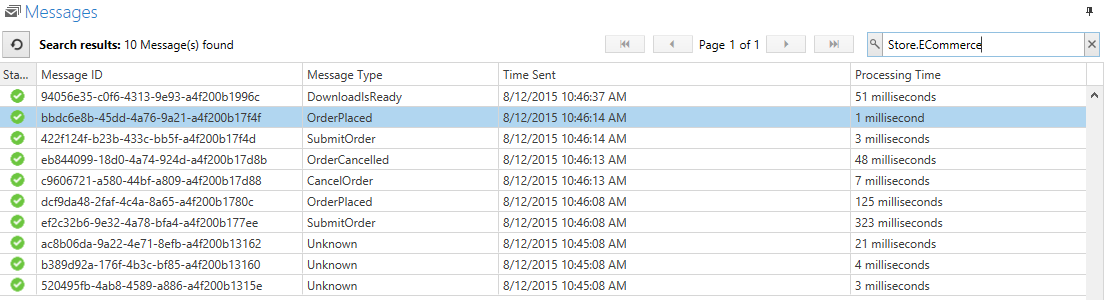
The Messages window
The Messages window is a detailed grid view indicating message status, type, time stamp, and service level information. Filter the list based on specific message content, searching for all message data, not just commonly displayed fields.
ServicePulse also supports opening ServiceInsight to a specific message to allow drill down for more detail.
A message's body is searchable only if the body size is under 85kB, under the ServiceControl. size limit, and is a non-binary content type.
Refresh and Auto-refresh
The Refresh and Auto-refresh toolbar buttons update the displayed information with the latest updates from the ServiceControl database.
Auto-refresh keeps the information in ServiceInsight automatically refreshed, delivering near real-time information to the views.
The auto-refresh rate can be specified in the View -> Options -> Auto-Refresh Timer setting (default is every 15 seconds), or by using the ServiceInsight invocation parameter (see ServiceInsight Application Invocation).
Timing and performance
Use the performance-related information in the message header to sort the messages in an endpoint based on the time the messages were sent, critical time, processing time, delivery time, message type and ID.
The message timing measurements include:
- Processing Time: the amount of time taken to process the message within the processing endpoint by the message processing handler method
Sorting
Messages can be sorted in ascending or descending order using the column headers. The sorting operation is applied to all the relevant messages in the underlying ServiceControl instance, not just the currently displayed messages.
Detailed view
Select a specific message to view the details for that message.
Endpoint Explorer
The Endpoint Explorer indicates the connection to the ServiceControl instance providing data to ServiceInsight. The list enumerates the endpoints and the machine where they are deployed.
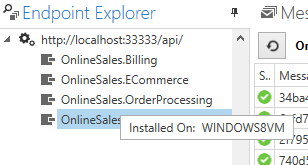
Select endpoints to filter the message list. Select the root ServiceControl connection and the tree view to make the list expand to include all messages.
Multiple ServiceControl connections
Starting with version 2.4.0, ServiceInsight can be connected to more than one ServiceControl instance at a time. Each connected ServiceControl instance will be displayed in the Endpoint Explorer and endpoints belonging to each instance will be grouped under the instance node. Selecting an instance gives the option to disconnect ServiceInsight from that ServiceControl instance.
Flow diagram
The flow diagram provides extensive message and system information. When messages are selected in the message list, the flow diagram illustrates the message and all related messages from the same conversation, along with the nature of the messages and the endpoints involved.
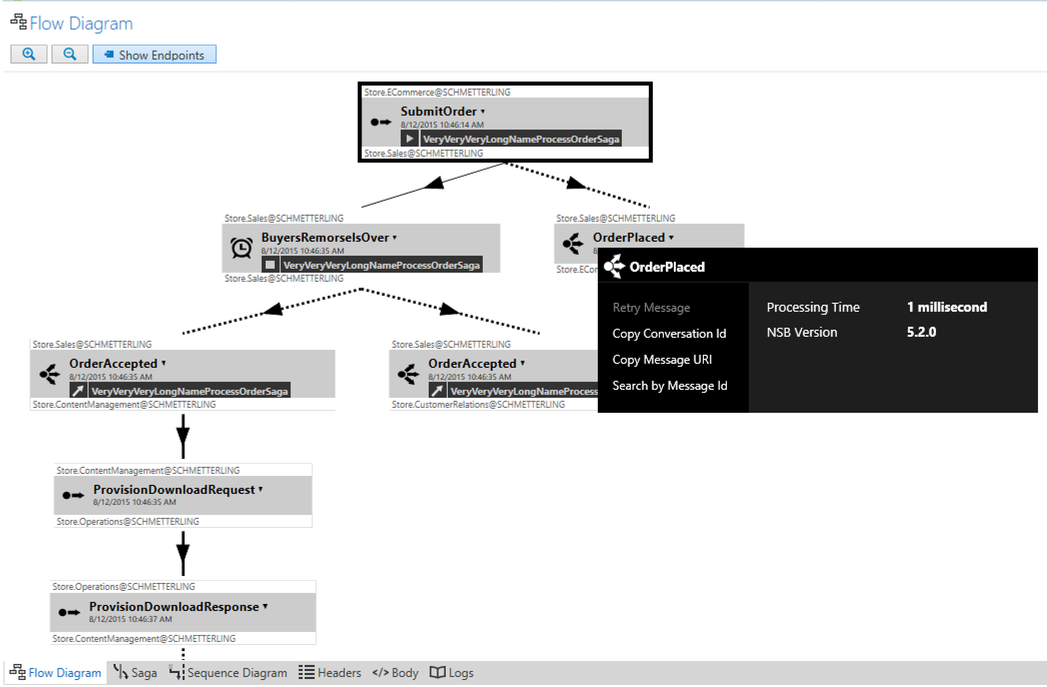
Each message is represented by a box indicating the message type and illustrating details including the endpoints and time information. Published events and sent commands have different icons and illustrations. Dropdowns provide more message details and links to search based on this message, copy message details, and retry messages.
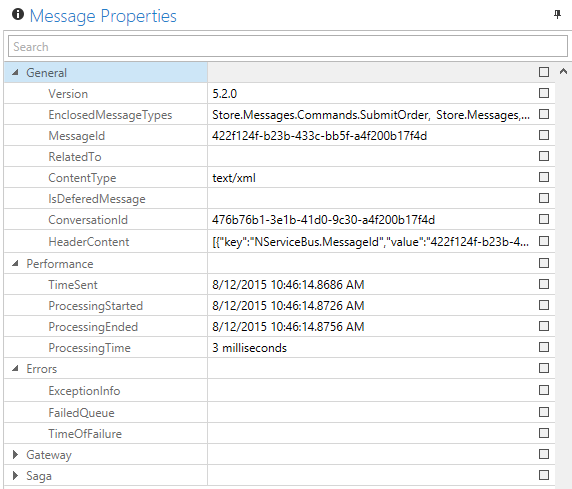
Message properties
Each message in NServiceBus contains extensive detail. As messages are selected in the flow diagram or in the list, an additional Message Properties window lists the properties for the message.
The Saga view
Sagas play a critical role in NServiceBus systems. As coordinators of processes, they are started by certain messages and interact with a variety of messages and services. To open a graphical view of sagas, click a message in the flow diagram that is handled by a saga.
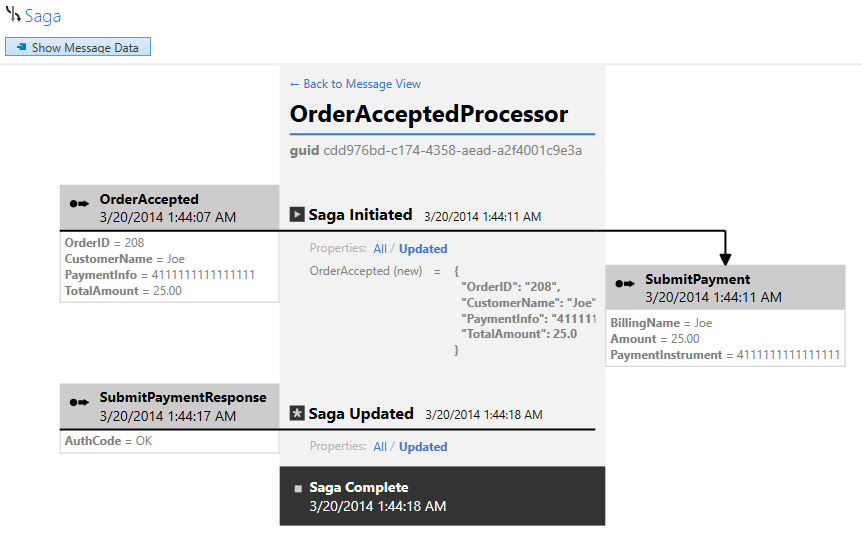
The saga diagram illustrates how the saga was initiated and other messages that were sent or handled, with detailed message data, time information, and details on saga data changes.
Sequence diagram
While a flow diagram is useful for showing why each message in a conversation was sent, a sequence diagram is better for understanding when messages were sent and handled.
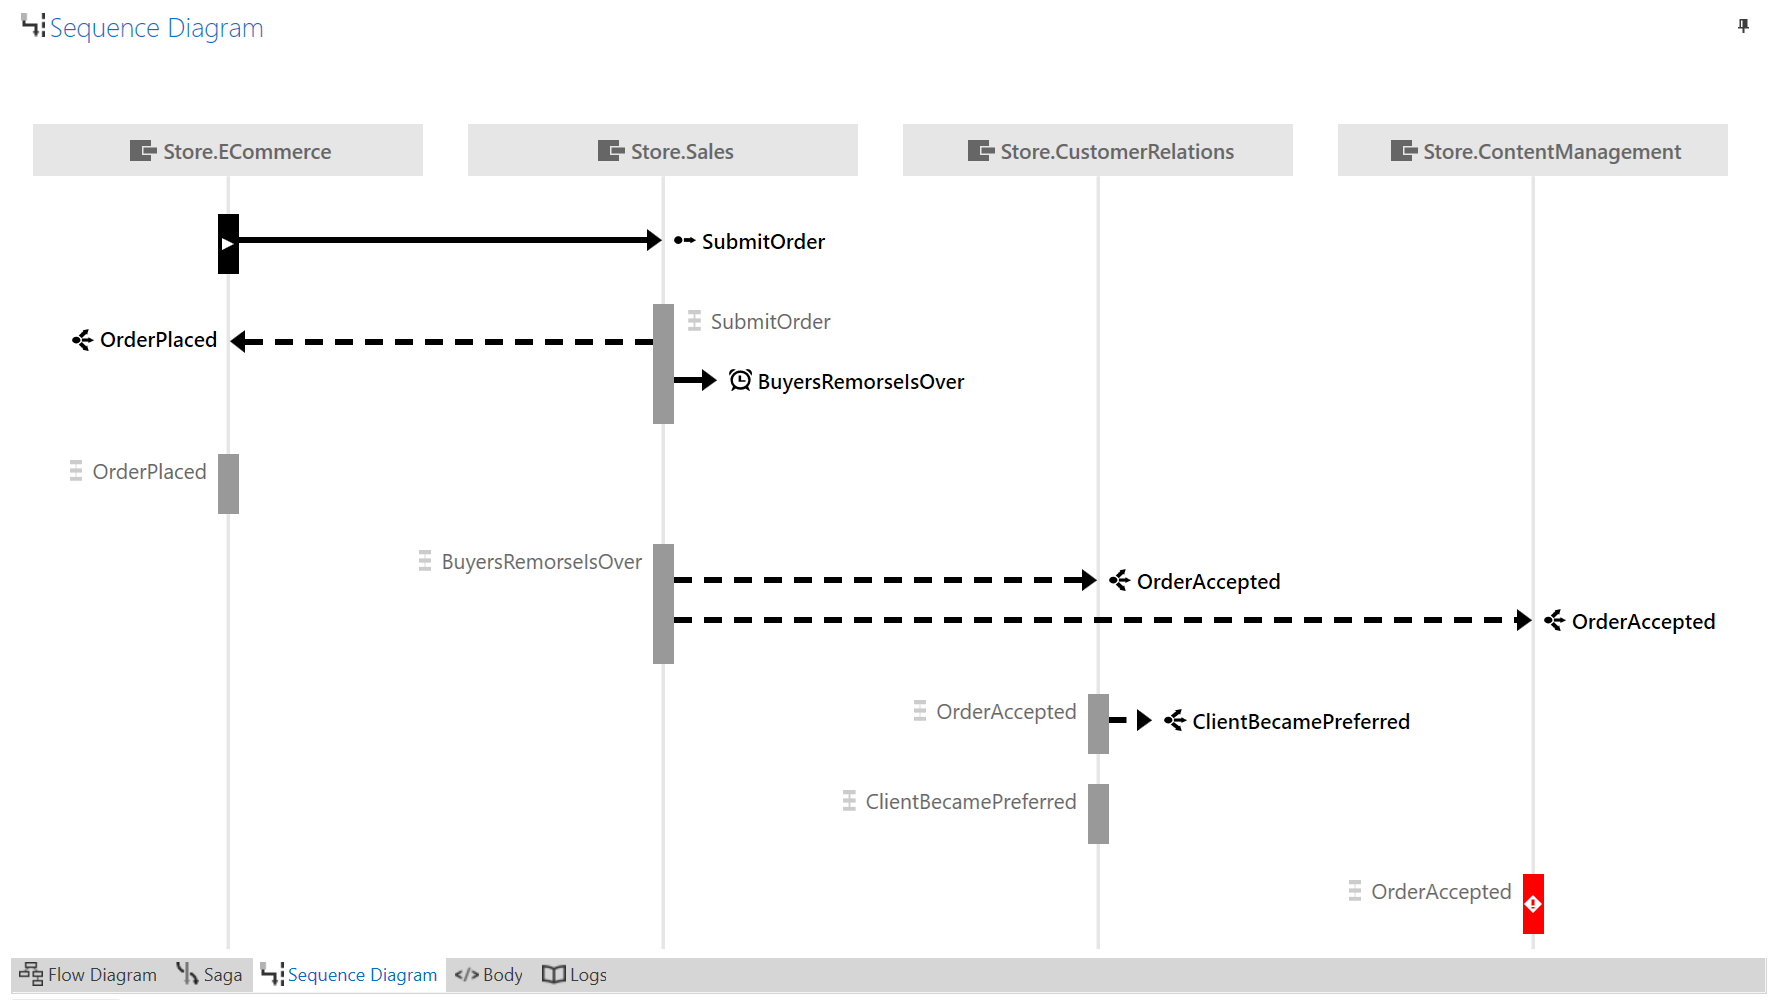
Read more about the Sequence Diagram.
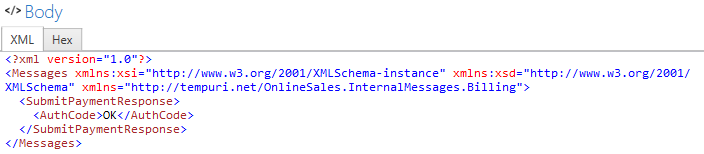
Body view
ServiceInsight can show the body of a message in either XML or JSON format, as well as raw HEX.
Custom message viewers
ServiceInsight has an extensibility point for custom message viewers. These are useful when a custom serializer is used or when the message is partially or fully encrypted and access to messages in clear text is required in ServiceInsight.
Read more about the custom message viewers and the plugin model.
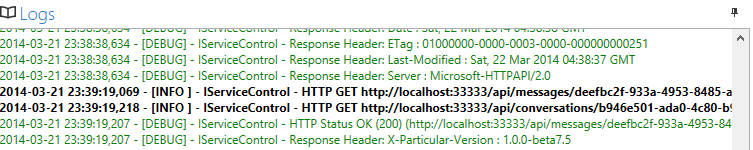
Log view
ServiceInsight leverages the ServiceControl API to retrieve information. The Log tab of the Flow Diagram window displays details of the interactions as ServiceInsight polls ServiceControl for more data.